Peer Influence
Understanding how interpersonal relations shape attitudes and behaviors, with a focus on peer influence models and new statistical methods for group detection in communication networks.

Peer Influence
E N D
Presentation Transcript
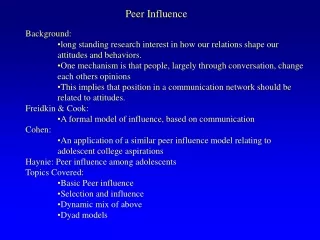
Peer Influence • Background: • long standing research interest in how our relations shape our attitudes and behaviors. • One mechanism is that people, largely through conversation, change each others opinions • This implies that position in a communication network should be related to attitudes. • Freidkin & Cook: • A formal model of influence, based on communication • Cohen: • An application of a similar peer influence model relating to adolescent college aspirations • Haynie: Peer influence among adolescents • Topics Covered: • Basic Peer influence • Selection and influence • Dynamic mix of above • Dyad models
Addendum A new statistic for determining the number of groups in a network. • The basic point still holds: finding groups takes a good deal of judgement. • BUT, some statistics can help. • The basic output from PROC CLUSTER • A new measure proposed in Molecular Biology: Modularity
Addendum A new statistic for determining the number of groups in a network. Proc cluster gives you a statistic for the basic “fit” of a cluster solution. This statistic varies depending on the method used, but is usually something like an R2. Consider this dendrogram:
Addendum A new statistic for determining the number of groups in a network. Proc cluster gives you a statistic for the basic “fit” of a cluster solution. This statistic varies depending on the method used, but is usually something like an R2. Consider this dendrogram: The SPRSQ and the RSQ are your fit statistics.
Addendum A new statistic for determining the number of groups in a network. A sharp change in the statistic is your best indicator. RSQ SPRSQ
Addendum A new statistic for determining the number of groups in a network. Modularity: M is the modularity score S indexes each group (“module”) ls is the number of lines in group s L is the total number of lines ds is the sum of the degrees of the nodes in s Nm is the number of groups
Addendum A new statistic for determining the number of groups in a network. Modularity:
20 10 5 Pii=.3 Pii=.2 Pii=.1 Addendum A new statistic for determining the number of groups in a network. Modularity:
Basic Peer Influence Model • Attitudes are a function of two sources: • a) Individual characteristics • Gender, Age, Race, Education, Etc. Standard sociology • b) Interpersonal influences • Actors negotiate opinions with others
Basic Peer Influence Model • Freidkin claims in his Structural Theory of Social Influence that the theory has four benefits: • relaxes the simplifying assumption of actors who must either conform or deviate from a fixed consensus of others (public choice model) • Does not necessarily result in consensus, but can have a stable pattern of disagreement • Is a multi-level theory: • micro level: cognitive theory about how people weigh and combine other’s opinions • macro level: concerned with how social structural arrangements enter into and constrain the opinion-formation process • Allows an analysis of the systemic consequences of social structures
Basic Peer Influence Model Formal Model (1) (2) Y(1) = an N x M matrix of initial opinions on M issues for N actors X = an N x K matrix of K exogenous variable that affect Y B = a K x M matrix of coefficients relating X to Y a = a weight of the strength of endogenous interpersonal influences W = an N x N matrix of interpersonal influences
Basic Peer Influence Model Formal Model (1) This is the standard sociology model for explaining anything: the General Linear Model. It says that a dependent variable (Y) is some function (B) of a set of independent variables (X). At the individual level, the model says that: Usually, one of the X variables is e, the model error term.
Basic Peer Influence Model (2) This part of the model taps social influence. It says that each person’s final opinion is a weighted average of their own initial opinions And the opinions of those they communicate with (which can include their own current opinions)
Basic Peer Influence Model The key to the peer influence part of the model is W, a matrix of interpersonal weights. W is a function of the communication structure of the network, and is usually a transformation of the adjacency matrix. In general: Various specifications of the model change the value of wii, the extent to which one weighs their own current opinion and the relative weight of alters.
Basic Peer Influence Model 2 1 Self weight: 1 2 3 4 1 .33 .33 .33 0 2 .33 .33 .33 0 3 .25 .25 .25 .25 4 0 0 .50 .50 1 2 3 4 1 1 1 1 0 2 1 1 1 0 3 1 1 1 1 4 0 0 1 1 Even 3 4 2*self 1 2 3 4 1 .50 .25 .25 0 2 .25 .50 .25 0 3 .20 .20 .40 .20 4 0 0 .33 .67 1 2 3 4 1 2 1 1 0 2 1 2 1 0 3 1 1 2 1 4 0 0 1 2 degree 1 2 3 4 1 .50 .25 .25 0 2 .25 .50 .25 0 3 .17 .17 .50 .17 4 0 0 .50 .50 1 2 3 4 1 2 1 1 0 2 1 2 1 0 3 1 1 3 1 4 0 0 1 1
Basic Peer Influence Model Formal Properties of the model (2) When interpersonal influence is complete, model reduces to: When interpersonal influence is absent, model reduces to:
Basic Peer Influence Model Formal Properties of the model If we allow the model to run over t, we can describe the model as: The model is directly related to spatial econometric models: Where the two coefficients (a and b) are estimated directly (See Doreian, 1982, SMR)
Basic Peer Influence Model Simple example 2 1 1 2 3 4 1 .33 .33 .33 0 2 .33 .33 .33 0 3 .25 .25 .25 .25 4 0 0 .50 .50 Y 1 3 5 7 a = .8 3 4 T: 0 1 2 3 4 5 6 7 1.00 2.60 2.81 2.93 2.98 3.00 3.01 3.01 3.00 3.00 3.21 3.33 3.38 3.40 3.41 3.41 5.00 4.20 4.20 4.16 4.14 4.14 4.13 4.13 7.00 6.20 5.56 5.30 5.18 5.13 5.11 5.10
Basic Peer Influence Model Simple example 2 1 1 2 3 4 1 .33 .33 .33 0 2 .33 .33 .33 0 3 .25 .25 .25 .25 4 0 0 .50 .50 Y 1 3 5 7 a = 1.0 3 4 T: 0 1 2 3 4 5 6 7 1.00 3.00 3.33 3.56 3.68 3.74 3.78 3.81 3.00 3.00 3.33 3.56 3.68 3.74 3.78 3.81 5.00 4.00 4.00 3.92 3.88 3.86 3.85 3.84 7.00 6.00 5.00 4.50 4.21 4.05 3.95 3.90
Basic Peer Influence Model Extended example: building intuition Consider a network with three cohesive groups, and an initially random distribution of opinions: (to run this model, use peerinfl1.sas)
Simulated Peer Influence: 75 actors, 2 initially random opinions, Alpha = .8, 7 iterations
Simulated Peer Influence: 75 actors, 2 initially random opinions, Alpha = .8, 7 iterations
Simulated Peer Influence: 75 actors, 2 initially random opinions, Alpha = .8, 7 iterations
Simulated Peer Influence: 75 actors, 2 initially random opinions, Alpha = .8, 7 iterations
Simulated Peer Influence: 75 actors, 2 initially random opinions, Alpha = .8, 7 iterations
Simulated Peer Influence: 75 actors, 2 initially random opinions, Alpha = .8, 7 iterations
Simulated Peer Influence: 75 actors, 2 initially random opinions, Alpha = .8, 7 iterations
Simulated Peer Influence: 75 actors, 2 initially random opinions, Alpha = .8, 7 iterations
Basic Peer Influence Model Extended example: building intuition Consider a network with three cohesive groups, and an initially random distribution of opinions: Now weight in-group ties higher than between group ties
Simulated Peer Influence: 75 actors, 2 initially random opinions, Alpha = .8, 7 iterations, in-group tie: 2
Consider the implications for populations of different structures. For example, we might have two groups, a large orthodox population and a small heterodox population. We can imagine the groups mixing in various levels: Heterodox: 10 people Orthodox: 100 People Little Mixing Heavy Mixing Moderate Mixing .95.001 .001.02 .95.008 .008.02 .95.05 .05.02
Light Heavy Moderate