Download
1 / 28
280 likes | 299 Vues
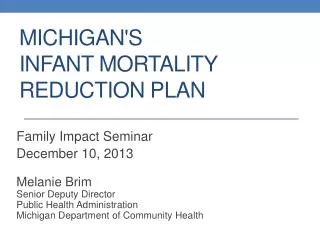
This slide set, provided by Dr. Elizabeth J. Conrey, demonstrates how the content from the Infant Mortality Toolkit can be effectively translated for training public health practitioners. The slides focus on Stage 2 of the toolkit's framework, which involves a focused investigation of maternal socio-demographic characteristics and behavioral risk factors. Attendees will learn how to design a community analysis plan to identify potential determinants of infant mortality.

E N D
This slide set, provided by Elizabeth J Conrey, PhD, RD, is an example of how the content from the Infant Mortality Toolkit can be translated for training public health practitioners • The slides are a subset from the course titled: The Epidemiology of Maternal and Infant Health for State and Local Practitioners, given at the Ohio State University Summer Program in Population Health • Examples provided are from the Ohio Department of Health State Example: Translating Infant Mortality Toolkit Content
Content from Days 3&4 - Toolkit Chapters Addressed: • SIM Toolkit: A Framework for Infant Mortality Assessments • The slides describe Stage 2 of the Framework, Focused Investigation • Examine maternal socio-demographic characteristics and behavioral risk factors (race/ethnicity, maternal age, plurality, nativity, maternal education, behavioral risks and pregnancy-related risks) • Design a community analysis plan State Example: Translating Infant Mortality Toolkit Content
The Epidemiology of Maternal and Infant Health for State and Local Practitioners Elizabeth J Conrey, PhD, RD July 22-26, 2015 The Ohio State University, 2015 Summer Program in Population Health
Stage 2: Focused Investigation • No SINGLE factor THE cause of infant mortality • Commonly the result of MULTIPLE contributing factors to the birth of a high-risk infant and influencing subsequent survival
Exploring Potential Determinants of Infant Death – Working Backwards
Stage 2: Focused Investigation • Full assessment of infant mortality rates should consider • Potential changes (+/-) among diverse risk factors • Maternal socio-demographic characteristics and behaviors • Attributes of social and physical environment • Systems of care Develop a community analysis plan considering • Direct contributing factors (e.g., smoking) • Indirect contributing factors (e.g., poverty)
MATERNAL SOCIO-DEMOGRAPHIC CHARACTERISTICS & BEHAVIORAL RISK FACTORS • Maternal socio-demographic characteristics, behavioral risk factors and pregnancy attributes influence infant mortality and other poor birth outcomes • Socio-cultural issues (poverty, access to care, racism) • Maternal characteristics (age, race/ethnicity, marital status, income, employment, education, SES, nativity, immigrant status, insurance coverage) • Behavioral risks (tobacco, other substance use, physical activity, nutrition) • Pregnancy-related risks (obesity, maternal complications & infections, parity/gravity, pregnancy spacing, prior pregnancy outcomes, pre-pregnancy health status) • Genetic (including paternal) and intergenerational risks • Beliefs and attitudes (including pregnancy intendedness)
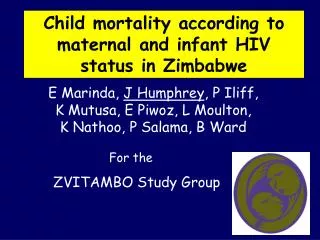
RACE / ETHNICITY • Hispanic ‘epidemiological paradox’ • Generally good outcomes despite higher SES and demographic risks • Remember: Hispanic is a heterogeneous group • Ideally investigated separately • Puerto Rican IMR 7.3 vs. Central/S. American 4.8)* • Ohio numbers relatively small though *2008, US • Considerable disparities • Not etiologic • Marker or proxy for differential risk • What contributes? • Differential risk exposures • Differential maternal health status • Access to health services • Cultural factors • ???
RACE / ETHNICITY: Measurement Limitations in VS • Socioeconomic and cultural factors not all found in VS • Some can be investigated in alternate sources such as BRFSS and PRAMS • When mothers race missing (<2%), NCHS • Imputes from fathers race • Imputes from previous record • Ohio numbers relatively small though • Multiple race reporting • “bridged” to single race by NCHS for comparison by across states and time (complex) *2008, US • Social (not biological) categories • Societies define differently • Typical US race categories: • Black or African American • White • Asian • American Indian or Alaska Native • Native Hawaiian or Pacific Islander • Multiracial • Ethnicity • Hispanic (yes/no)
MATERNAL AGE Infant Mortality, by Maternal Age, Ohio, 2010 • Must use linked birth-death records • Useful initial categories: • 5-year groupings • Teens • 15-17 • 18-19 • Generally follow U-shaped distribution • Obstetric, biological, socio-economic factors
Trends in Teen (15-17) Births, by Race and Ethnicity, Ohio, 2006-2013
PLURALITY • Multiples have greater risks • Preterm (60% twins; >90% triplets) • Infant mortality (twins 5x that of singletons) • 3% of births in 2007 but 15% of deaths • Changes attributed to fertility management • Multiple births have represented growing population but • U.S. twin rate has been steady since 2009 and was 33.1/1000 (2012) • Triplets and higher have dropped > 1/3 since the high in 1998 (193.5/1000)
NATIVITY • Better birth outcomes reported among mother born outside 50 states and DC • even after controlling for socio-demographic factors • IMR • US-born mothers 7.0 • Foreign-born mother 5.1 • Explanations: • Healthy migrant effect • Social support and ties within immigrant populations after arriving in the US (may buffer adverse SES) • Risky behaviors lower among foreign-born mothers (e.g., tobacco use) • Stratification by nativity in assessment may reveal differences • Long-term exposure to racism, discrimination and stress may be experienced by people of color and contribute to higher IMRs among U.S.-born mothers
Ohio resident births to mothers with black race, by mother’s nativity and gestational age* Percent of live births Source: Ohio Department of Health, Office of Vital Statistics ( 6/12/2013) *obstetric estimate
MATERNAL EDUCATION Infant Mortality Rate by Maternal Education, 22 US States, 2007 • Low educational attainment associated with poor pregnancy outcomes • Measurement with 2003 standard birth certificate • Not comparable from prior version (in Ohio pre-2006 vs. 2006+) • Careful comparing across states • Categories • Less than HS diploma ; HS diploma; some college or technical; bachelors + • Old version quantified in years • Related to other maternal characteristics associated with IM
BEHAVIORAL RISKS Smoking before, during and after pregnancy, Ohio 2010 PRECONCEPTION HEALTH • Known risk factors begin long before a woman becomes pregnant • Tobacco, alcohol, other substance abuse • Inadequate nutrition • Obesity • Stress • Best addressed BEFORE pregnancy begins • Measurement • Limited from VS • Most from PRAMS or BRFSS Source: Ohio Pregnancy Risk Assessment Monitoring System, Ohio Department of Health
Smoking during the last 3 months of pregnancy, by demographics, Ohio 2009-10
PREGNANCY-RELATED RISKS • Complications and conditions that occur before and during pregnancy PRECONCEPTION CONDITIONS • Chronic conditions • Asthma • Diabetes • Hypertension • Obesity • Mental Health • EXAMPLE: prepregnancy hypertension →preeclampsia and placental abruptions • Best addressed BEFORE becoming pregnancy OBSTETRIC • Placental conditions, preeclampsia, and Intrauterine growth restriction (and others) develop during pregnancy • Increase likelihood of high risk delivery • Untreated Infections (Group B Strep, influenza, STIs) • Increase risk of pregnancy complications and infant death • Outcomes of previous pregnancies • May be repeated • Conditions may persist
DESIGNING A COMMUNITY ANALYSIS PLAN Remember to bring entire team together to review phase I findings and plan phase II analyses
DESIGNING A COMMUNITY ANALYSIS PLAN: Consider • Maternal socio-demographic characteristics & behavioral risk factors • Attributes of social & physical environment • Systems of care • What contributors are associated w/ excess IM or adverse pregnancy outcome? • What are direct vs. indirect contributors? • How does the distribution of these contributors vary (by time, geography, demographics) • What are the relative risks for these contributors? • What are the Population Attribution Fractions for the contributors? • Do successful programs/practices exist for addressing these contributors?
Maternal socio-demographic characteristics & behavioral risk factors 1. Assess available surveillance data 2. Determine population of interest 3. Obtain data for each subgroup & measure the prevalence of each attribute 4. Focus efforts on attributes that exhibit highest or most disparate rates from reference groups
Maternal socio-demographic characteristics & behavioral risk factors if deaths occurring mostly among moms ≥35 years w/ private insurance, may want fertility clinic data or VS information related to assisted reproductive technologies, as this may contribute to infant mortality in your area Most appropriate data on maternal risks might be best collected with qualitative methodologies. team may implement focus groups with postpartum women to better understand the effect of discrimination on receipt of care, or may interview providers to assess how women access ancillary mental health services during pregnancy. Data team wants may be unavailable. Team may recommend implementing NEW systems for better understanding (e.g., FIMR )
Attributes of social & physical environment • SOCIAL ENVIRONMENT • Review measures of social determinants of health (poverty, incarceration, dissimilarity index) -- compare racial and ethnic groups in your setting to US • Programs and policies serving vulnerable populations. • Develop questions from these measures about access, effectiveness, and efficiency to begin measuring associations between the social environment & infant mortality • PHYSICAL ENVIRONMENT & EXPOSURES • Review Agency for Toxic Substances and Disease Registry (ATSDR) website • (Division of Health Assessment and Consultation) • Information on community assessments (www.atsdr.cdc. gov/HAC/PHA/index.asp). • Assess community indicators and tools to measure prevention, including the built environment • Community Health and Health Equity Program (www.cdc.gov/nccdphp/dach/chhep • Data Environmental Quality Index: Availability, Quality, and Utility (http://ajph.aphapublications.org/doi/full/10.2105/ AJPH.2011.300184) • The Community Guide (www.thecommunityguide.org/index.html).
Systems of Care (Health service attributes & utilization) • Examine • area hospital systems • types of services provided • how clinics and hospitals define services (i.e., program/service definitions; Certificate of Need) • percentage of high-risk women cared for at those facilities • percentage of infants delivered at those facilities • quality of the care and services provided to those women and infants. • These together with attributes of systems of care describe health service in general & its contributing effect on infant mortality • understanding delivery volume in a level II hospital & time to neonatal transport may explain a portion of underlying contribution to IM. Understanding how risk-appropriate care is defined in your state is integral • Qualitative methodologies may be useful
DESIGNING A COMMUNITY Analysis PLAN • Resources • CDC 2013 “Creating an Analysis Plan Workbook http://www.cdc.gov/globalhealth/fetp/training_modules/9/creating-analysis-plan_pw_final_09242013.pdf