Download
1 / 16
160 likes | 357 Vues
Beryllium Hollow Cube Retroreflector. Thermal Distortion Analysis C. Powell/542 T. Carnahan/542 S. Irish/542 A. Morell/544. Retroreflector. Materials:. Beryllium Plates. Stycast 2850 Bonding (.05” thick). Material Properties Used in Analysis. Beryllium: Young’s Modulus - 40E+6 psi

E N D
Beryllium Hollow Cube Retroreflector Thermal Distortion Analysis C. Powell/542 T. Carnahan/542 S. Irish/542 A. Morell/544
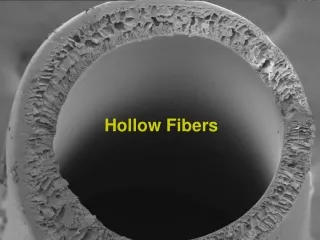
Retroreflector Materials: Beryllium Plates Stycast 2850 Bonding (.05” thick)
Material Properties Used in Analysis • Beryllium: • Young’s Modulus - 40E+6 psi • Poisson’s Ratio - .1 • Density - .067 lb/in³ • CTE - 11.2E-6 /ºC • Yield Strength - 10,000 psi • Stycast 2850: • Young’s Modulus - 4.0E+6 psi • Poisson’s Ratio - .3 • Density - .087 lb/in³ • CTE - 3.5E-5 /ºC • Yield Strength - 5100 psi (lowest of possible values)* *Various material sources have indicated a yield strength range from 5100 psi to 8400 psi.
Structural Model Kinemetically mounted on Beryllium plate lying in Y Z plane Blue triangles represent location of constraint. 1, 2, and 3 represent being fixed in the x, y, and z directions respectively.
Types of Temperature Loads Performed in Analysis 1 °C Bulk Temperature Change for pure Be FEM and a FEM with Stycast bonding -A FEM made up of entirely Be will expand without any surface distortion. -Change temperature of both FEM from 20 °C to 21 °C. Compare both models’ deflections. -Purpose: Determine the distortion caused by the CTE mismatch in Beryllium and Stycast. Determine the maximum stress value and location in Stycast in order to see whether a 80 °C temperature increase is feasible.
Types of Temperature Loads Performed in Analysis Cont. 1 °C Temperature Gradient in X, Y, and Z Directions for a pure Be FEM and a FEM with Stycast bonding -Apply a 1 °C linear temperature gradient load along x, y, and z directions for both models. Compare both models’ deflections. -Purpose: Determine the difference in deflections between a FEM made of only Be versus a FEM with Stycast bonding. Determine maximum stress quantity and location in Stycast in order to determine the maximum temperature gradient through the retroreflector.
1 °C Bulk Temperature Analysis Results With Stycast Pure Beryllium Contour Plot of Maximum Deflections .559 µm .526 µm .490 µm .454 µm .419 µm .384 µm .351 µm .315 µm .279 µm .245 µm .210 µm .175 µm .140 µm .106 µm .070 µm .035 µm 0 .556 µm .521 µm .488 µm .452 µm .417 µm .383 µm .348 µm .312 µm .277 µm .243 µm .208 µm .174 µm .139 µm .104 µm .069 µm .035 µm 0 Contour map applies for FEM with and without Stycast bonding. Keys are defined for each case.
1 °C Bulk Temperature Analysis Results Cont. 328.8 psi 312.6 psi 296.3 psi 280.1 psi 263.9 psi 247.7 psi 231.5 psi 215.3 psi 199.1 psi 182.9 psi 166.7 psi 150.5 psi 134.3 psi 118.1 psi 101.9 psi 85.67 psi 69.47 psi Contour Plot of Maximum Stresses Stycast – limiting factor, only Stycast is shown
1 °C Bulk Temperature Analysis Results Cont. Max Stress = 328.8 psi Using a factor of safety of 2 yields a margin of safety of 6.756 for a 1°C bulk temperature change. 328.8 psi 312.6 psi 296.3 psi 280.1 psi 263.9 psi 247.7 psi 231.5 psi 215.3 psi 199.1 psi 182.9 psi 166.7 psi 150.5 psi 134.3 psi 118.1 psi 101.9 psi 85.67 psi 69.47 psi Contour Plot of Maximum Stress in Stycast Bonding
1 °C Linear Temperature Gradient Load in X Direction Contour Plot of Displacement due to 1°C Gradient in X Direction With Stycast Pure Beryllium .312 µm .292 µm .272 µm .253 µm .233 µm .214 µm .195 µm .175 µm .156 µm .136 µm .116 µm .097 µm .077 µm .058 µm .039 µm .019 µm 0 .310 µm .290 µm .269 µm .251 µm .232 µm .212 µm .193 µm .174 µm .154 µm .135 µm .116 µm .097 µm .077 µm .058 µm .039 µm .019 µm 0 Contour Plot applies for FEM with and without Stycast bonding.
1 °C Linear Temperature Gradient Load in X Direction Cont. 278.6 psi 261.8 psi 244.9 psi 228.0 psi 211.1 psi 194.2 psi 177.3 psi 160.4 psi 143.5 psi 126.6 psi 109.7 psi 92.81 psi 75.91 psi 59.02 psi 42.12 psi 25.23 psi 8.332 psi Contour Plot of Maximum Stresses in Stycast Bonding
1 °C Linear Temperature Gradient Load in X Direction Cont. Using a Factor of Safety of 2 yields a Margin of Safety of 8.153 for a 1 °C temperature gradient in the x direction. 278.6 psi 261.8 psi 244.9 psi 228.0 psi 211.1 psi 194.2 psi 177.3 psi 160.4 psi 143.5 psi 126.6 psi 109.7 psi 92.81 psi 75.91 psi 59.02 psi 42.12 psi 25.23 psi 8.332 psi Contour Plot of Maximum Stresses in Stycast Bonding
1 °C Linear Temperature Gradient Load in Y and Z Directions Maximum Deflections Temp Gradient in Y direction with Stycast - .396 µm Temp Gradient in Y direction without Stycast - .394 µm Temp Gradient in Z direction with Stycast - .376 µm Temp Gradient in Z direction without Stycast - .374 µm Maximum Stress in Stycast Bonding Temp Gradient in Y direction – 278.7 psi Temp Gradient in Z direction – 277 psi
Summary of Results (FEM with Stycast only) 1 °C Bulk Temperature Change: Maximum Distortion due to CTE mismatch in Beryllium and Stycast = .0051 µm 1 °C Temperature Gradient in X, Y, and Z directions Distortion Between Maximums = .00254, .00508, .00254 µm respectively Conclusion: Distortion is not a concern when the Beryllium retroreflector with Stycast bonding is subjected to a large temperature increase. Largest delta deflection was found to be .005 µm which meets the requirements of less than .01 µm.
Summary of Results (FEM with Stycast only) Cont. 1 °C Bulk Temperature Change: Using a Factor of Safety equal to 2, margin of safety = 6.756 Maximum Allowable Temperature Change = 7.756 °C 1 °C Temperature Gradient in X, Y, and Z directions Using a Factor of Safety equal to 2, margin of safety = 8.153, 8.150, and 8.206 respectively Maximum Allowable Temperature Change = 9.153, 9.150, and 9.206 °C respectively Conclusion: The structural analysis indicates that the stress in the Stycast is not able to withstand a 80°C delta temperature increase. However, it is believed that the analysis is conservative using a high factor of safety and a low yield strength. Also, an instrument design developed at GSFC utilized a glass part bonded with Stycast and it was able to withstand a temperature decrease from room temperature to 80K without degradation to the bond. Surface preparation is critical to the strength of bonded joints and the structural analysis is not able to model this effect.
Recommendations and Further Work • The structural analysis is currently using the most conservative yield strength for Stycast 2850. • - It is recommended that strength testing be performed to determine the appropriate yield strength of Stycast due to thermal loading. Various surface preparations should be considered. • The structural analysis is currently assuming that the retroreflector design must be able to withstand a temperature of 100 C (ie, a 80 C delta temperature increase). • - It is recommended that a thermal analysis be performed to determine the actual temperature environment.