Download
1 / 1
10 likes | 197 Vues
James A. Russell, Ph.D. 1 , Karen Kirtland, Ph.D. 2 , Dawn K. Wilson, Ph.D. 2 , Nadia Craig 1 , Veronica Addison 1 , Wally Peters, Ph.D. 1 1 University of South Carolina, Department of Engineering, 2 Arnold School of Public Health, and Prevention Research Center, Columbia, South Carolina.

E N D
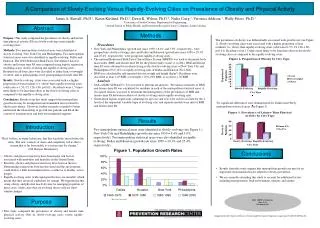
James A. Russell, Ph.D.1, Karen Kirtland, Ph.D.2, Dawn K. Wilson, Ph.D.2, Nadia Craig 1, Veronica Addison 1, Wally Peters, Ph.D.1 1University of South Carolina, Department of Engineering, 2Arnold School of Public Health, and Prevention Research Center, Columbia, South Carolina Abstract * Based on Census data A Comparison of Slowly-Evolving Versus Rapidly-Evolving Cities on Prevalence of Obesity and Physical Activity Methods Purpose: This study compared the prevalence of obesity and leisure time physical activity (PA) in slowly-evolving versus rapidly-evolving cities. Methods: Two metropolitan statistical areas were identified as slowly evolving: New York City and Philadelphia. Two metropolitan statistical areas were also identified as rapidly-evolving: Dallas and Houston. The 2002 Behavioral Risk Factor Surveillance data for obesity and leisure time PA were compared using logistic regression modeling across slowly-evolving and rapidly-evolving cities. Residents in all four cities were classified as either lean, overweight or obese; and as participating or not participating in leisure time PA. Results: Slowly-evolving cities were associated with a a higher proportion of lean residents (vs. obese) than rapidly-evolving cities (odds ratio = 1.53: CI 1.26-1.86, p<0.01). Residents were 1.5 times more likely to be lean than obese in the slowly-evolving cities as compared to the rapidly-evolving cities. Conclusions: Results from this study suggest that metropolitan growth rate may be an important environmental factor related to obesity prevalence. However, further research is needed to better understand the relationship of growth rate patterns and PA in the context of transportation and built environmental supports. The prevalence of obesity was differentially associated with growth rate (see Figure 2). Slowly-evolving cities were associated with a higher proportion of lean residents (vs. obese) than rapidly-evolving cities (odds ratio=1.53: CI 1.26-1.86, p<0.01). Residents were 1.5 times more likely to be lean than obese in the slowly-evolving cities as compared to the rapidly evolving cities. • Procedures • New York and Philadelphia (growth rate since 1950 = 8.4% and 5.0%, respectively). were grouped into slowly-evolving cities and Dallas and Houston (growth rate since 1950 = 29.3% and 25.4%, respectively). were group into rapidly-evolving cities. • The national Behavioral Risk Factor Surveillance System (BRFSS) was used to document body mass index (BMI) and leisure-time PA for the present study (some vs. no PA). BMI and leisure time PA were obtained for residents living in the slowly-evolving cities of New York City and Philadelphia (N=5,143) or rapidly-evolving cites of Dallas and Houston (N=1,864). • BMI was calculated by self-reported data for weight and height (kg/m2). Residents were classified as lean < 25 BMI, overweight = 25.0-29.9 BMI, or as obese > 30 BMI. • Analysis • SAS-callable SUDAAN v. 8.0 was used to perform all analyses. Prevalence estimates of BMI and leisure-time PA was calculated for residents in each of the metropolitan statistical areas. A chi square statistic was used to determine the homogeneity of the prevalences of BMI and leisure-time PA between residents of slowly-evolving versus rapidly-evolving cites. • Generalized logistic regressions (adjusting for age race and sex) were used to account for the 2 levels of the dependent variable (type of evolving city) and separate models were run for BMI and leisure-time PA. No significant differences were demonstrated for leisure-time PA by metropolitan statistical areas (see Figure 3). Results Introduction Two metropolitan statistical areas were identified as slowly evolving (see Figure 1): New York City and Philadelphia (growth rate since 1950 = 8.4% and 5.0%, respectively). Two metropolitan statistical areas were also identified as rapidly-evolving: Dallas and Houston (growth rate since 1950 = 29.3% and 25.4%, respectively). • “But I believe, as many before me, that this is just the storm before the calm. The new sciences of chaos and complexity tell us that a system that is far from stable is a system ripe for change.” • –J.M. Benyus Biomimicry • Obesity and physical inactivity have been major risk factors associated with morbidity and mortality in the United States. • Recently, obesity and physical inactivity have been on the rise. Determining connections between this trend and the environment could lead to a built environment that is conducive to healthy, active people. • Rapidly evolving cities (with rapid growth rates) are unstable, which means that they are good candidates for change. We hypothesize that rising obesity and physical inactivity may be emerging properties of these cities, while cities that are evolving slower will not show similar changes. Conclusions • Results from this study suggest that metropolitan growth rate may be an important environmental factor related to obesity prevalence. • We are currently extending this study to account for additional factors including transportation, built environment, climate, and culture. 2004 ISBNPA Conference June 10-13 Washington DC Purpose • This study compared the prevalence of obesity and leisure time physical activity (PA) in slowly-evolving cities versus rapidly-evolving cities. Supported by the Centers for Disease Control and Prevention Cooperative Agreement U48/CCU409664-06.