

BACKGROUND
E N D
Presentation Transcript
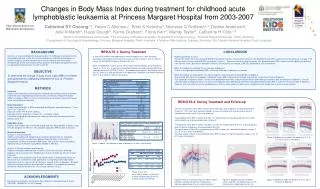
1School of Paediatrics & Child Health, The University of Western Australia.2Department of Endocrinology , Princess Margaret Hospital , Perth, Australia.3Department of Oncology & Haematology, Princess Margaret Hospital, Perth, Australia. 4Telethon Kids Institute, Subiaco, Australia. 5Sir Charles Gairdner Hospital, Perth, Australia BACKGROUND Survivors of acute lymphoblastic leukaemia (ALL) in childhood, have twice the risk of developing obesity in later life. An effect previously attributed to high doses of cranial irradiation. Despite replacement of cranial radiation with intra-thecalchemotherapy for the vast majority of ALL patients, overweight and obesity remains a major concern during treatment and in later life. OBJECTIVE To determine the change in body mass index (BMI) of children and adolescents undergoing treatment for ALL at Princess Margaret Hospital. Methods Overview Heights and weight were retrospectively collected from medical records of children treated for acute lymphoblastic leukaemia (ALL) at Princess Margaret Hospital (PMH) for children. PMH has 100% ascertainment of all children treated for cancer in the state of Western Australia. Study Population Children treated for ALL at PMH whose date of diagnosis occurred between 1st Jan 2003 – 31st Dec 2007. Inclusion criteria: Pre-B and T-cell ALL Exclusion criteria: Infant ALL, Trisomy 21, < 9 months of data. If a patient relapsed during treatment or follow up their data was censored at the previous clinic visit. Body Mass Index Heights and weights were converted to age and sex adjusted BMI z-scores using the CDC program for SAS 9.3. This program calculates BMI for ages 2-20 years. Statistical Analyses Analysis 1: During treatment Heights and weights at the beginning of selected treatment phases (induction, consolidation, interim maintenance, delayed-intensification, maintenance 1 – maintenance 12) were converted to BMI values. BMI z-scores were analysed by repeated measures ANOVA using PROC MIXED in SAS9.3 Analysis 2: During treatment and follow-up. Heights and weights obtained from all clinic visits for the five years following diagnosis were analysed. This included up to 3 years of follow-up after the end of treatment. BMI z-scores were analysed using linear mixed effects, including fixed effects for time since start of treatment (cubic polynomial) and significant time-dependent interactions with sex, age at start of treatment, severity of ALL at diagnosis. Random effects for intercept and time were included, in addition to a compound symmetry correlation structure for the errors (R statistical software v 3.0.2). RESULTS 1: During Treatment Conclusions A total of 80 children and adolescents were included in this study. Selected participant and treatment characteristic are presented in Tables 1 and 2. Figure 1 shows the distribution of age at diagnosis by sex. Mean (± SEM) BMI z-scores of the start of each treatment phase are presented in Figure 2. There was a significant interaction between sex and treatment phase by repeated measures ANOVA (P<0.01). The proportion of patients classified as obese by CDC criteria ( ≥ 95th percentile) at the beginning (induction) and end of treatment (EoT) is presented in Table 3 (see below). Model adjusted for sex only •Across the cohort there was accrual of BMI during treatment for ALL. By the end of treatment the predicted mean BMI z-scores had increased by, on average, 0.30 SDs for males (3 years) and 0.96 SDs for females (2 years). Two years after the end of treatment, the predicted mean BMI z-scores are not significantly different from zero for males, but remain elevated in females (increased by, on average, 0.69 SDs compared to start of treatment). When the models are adjusted for sex and age at diagnosis •There is an higher peak predicted BMI z-score with older age at diagnosis in females When the models are adjusted for sex, age at diagnosis and risk profile (standard/high) at diagnosis •For patients with high risk at diagnosis, predicted mean BMI z-scores do not change substantially irrespective of age at diagnosis •For standard risk patients, there is an accrual of predicted mean BMI z-score during treatment and follow-up in patients who are younger at diagnosis. For girls who were older at diagnosis there is an accrual of predicted mean BMI during treatment, with peak predicted mean BMI z-score increasing with age at diagnosis. However, after the end of treatment, predicted mean BMI z-scores decline for both sexes if diagnoses were made after 4 years of age or greater. Changes in Body Mass Index during treatment for childhood acute lymphoblastic leukaemia at Princess Margaret Hospital from 2003-2007 RESULTS 2: During Treatment and Follow-up 2 y 4 y 6 y Catherine SY Choong1,2, Helen C Atkinson1, Rishi S Kotecha3, Nicholas G Gottardo3,4, Denise Anderson4, Julie A Marsh4, Hazel Gough3, Kerrie Graham3, Fiona Kerr3, Mandy Taylor5, Catherine H Cole,1,3 The raw sex-specific mean BMI z-scores for the five years after diagnosis are presented below (Figure 3). This time frame typically includes 2 years of treatment for females and 3 years of treatment for males and 2-3 years of follow-up. The predicted mean BMI z-scores (with 95% CI) adjusted for sex only obtained from the mixed-effects model are also presented below (Figure 4). The predicted mean BMI z-scores (with 95% CI) from the model adjusted for sex, age at diagnosis and risk profile at diagnosis are presented on the right. The upper panel (Figure 5) are predicted mean BMI z-scores for standard risk patients at ages 2, 4, 6, 8, 10 & 12 years at diagnosis. The lower panel (Figure 6) are predicted mean BMI z-scores for high risk patients at ages 6, 8, 10 & 12 years at diagnosis. 8 y 10 y 12 y Figure 5: Models for standard risk patients at 2, 4, 6, 8, 10 & 12 years at diagnosis 0 5 10 15 Figure 1 (above): Distribution of age at diagnosis in males and females 6 y 8 y 10 y 12 y Figure 2 (see left): Mean BMI z-scores at the start of each treatment phase for ALL for both males and females. Acknowledgments Figure 3: Raw sex-specific means for BMI z-scores and 95% confidence intervals. Vertical bars indicate approximate time of end of treatment Figure 4: Predicted means for BMI z-scores and 95% confidence intervals for mixed effects model adjusted for sex Figure 6: Models for high risk patients at 6, 8 , 10 & 12 years at diagnosis This study was funded by the Telethon New Children’s Hospital Research Fund (TNCHRF) (#63002012 to CSY Choong).


