Pedestrian Environmental Quality Index Training Program
Pedestrian Environmental Quality Index Training Program. The PEQI was developed by the San Francisco Department of Public Health and modified for the Los Angeles street environment by Malia Jones, MPH of UCLA Last modified April 1, 2010. Agenda.

Pedestrian Environmental Quality Index Training Program
E N D
Presentation Transcript
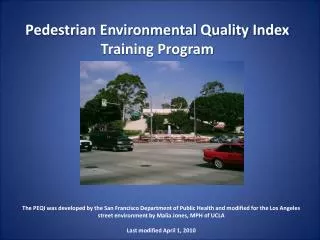
Pedestrian Environmental Quality IndexTraining Program The PEQI was developed by the San Francisco Department of Public Health and modified for the Los Angeles street environment by Malia Jones, MPH of UCLA Last modified April 1, 2010
Agenda • What is walkability and what does it have to do with health? • Street and intersection identification • PEQI assessment instructions • Practice using the PEQI
What is “walkability”? • Walkability means the physical environment’s ability to support and encourage walking • The quality and safety of the environment from the perspective of pedestrians • Includes: • Safety features • Traffic conditions • Aesthetic conditions
“Walkability” and your health: 1 • Walking reduces our dependence on cars • This reduces air pollution, noise pollution, traffic accidents
“Walkability” and your health: 2 2. Increases physical activity • Regular moderate physical activity (such as walking or cycling) reduces the risk of serious disease and obesity
What is obesity? • 30-40 lbs or more above healthy weight • Depends on height • For people who are still growing, depends on age & gender
Obesity Trends* Among U.S. AdultsBRFSS, 1985 (*BMI ≥30, or ~ 30 lbs. overweight for 5’ 4” person) No Data <10% 10%–14%
Obesity Trends* Among U.S. AdultsBRFSS, 1986 (*BMI ≥30, or ~ 30 lbs. overweight for 5’ 4” person) No Data <10% 10%–14%
Obesity Trends* Among U.S. AdultsBRFSS, 1987 (*BMI ≥30, or ~ 30 lbs. overweight for 5’ 4” person) No Data <10% 10%–14%
Obesity Trends* Among U.S. AdultsBRFSS, 1988 (*BMI ≥30, or ~ 30 lbs. overweight for 5’ 4” person) No Data <10% 10%–14%
Obesity Trends* Among U.S. AdultsBRFSS, 1989 (*BMI ≥30, or ~ 30 lbs. overweight for 5’ 4” person) No Data <10% 10%–14%
Obesity Trends* Among U.S. AdultsBRFSS, 1990 (*BMI ≥30, or ~ 30 lbs. overweight for 5’ 4” person) No Data <10% 10%–14%
Obesity Trends* Among U.S. AdultsBRFSS, 1991 (*BMI ≥30, or ~ 30 lbs. overweight for 5’ 4” person) No Data <10% 10%–14% 15-19%
Obesity Trends* Among U.S. AdultsBRFSS, 1992 (*BMI ≥30, or ~ 30 lbs. overweight for 5’ 4” person) No Data <10% 10%–14% 15-19%
Obesity Trends* Among U.S. AdultsBRFSS, 1993 (*BMI ≥30, or ~ 30 lbs. overweight for 5’ 4” person) No Data <10% 10%–14% 15-19%
Obesity Trends* Among U.S. AdultsBRFSS, 1994 (*BMI ≥30, or ~ 30 lbs. overweight for 5’ 4” person) No Data <10% 10%–14% 15-19%
Obesity Trends* Among U.S. AdultsBRFSS, 1995 (*BMI ≥30, or ~ 30 lbs. overweight for 5’ 4” person) No Data <10% 10%–14% 15-19%
Obesity Trends* Among U.S. AdultsBRFSS, 1996 (*BMI ≥30, or ~ 30 lbs. overweight for 5’ 4” person) No Data <10% 10%–14% 15-19%
Obesity Trends* Among U.S. AdultsBRFSS, 1997 (*BMI ≥30, or ~ 30 lbs. overweight for 5’ 4” person) No Data <10% 10%–14% 15-19% ≥ 20%
Obesity Trends* Among U.S. AdultsBRFSS, 1998 (*BMI ≥30, or ~ 30 lbs. overweight for 5’ 4” person) No Data <10% 10%–14% 15-19% ≥ 20%
Obesity Trends* Among U.S. AdultsBRFSS, 1999 (*BMI ≥30, or ~ 30 lbs. overweight for 5’ 4” person) No Data <10% 10%–14% 15-19% ≥ 20%
Obesity Trends* Among U.S. AdultsBRFSS, 2000 (*BMI ≥30, or ~ 30 lbs. overweight for 5’ 4” person) No Data <10% 10%–14% 15-19% ≥ 20%
Obesity Trends* Among U.S. AdultsBRFSS, 2001 (*BMI ≥30, or ~ 30 lbs. overweight for 5’ 4” person) No Data <10% 10%–14% 15-19% 20-24% ≥ 25%
Obesity Trends* Among U.S. AdultsBRFSS, 2002 (*BMI ≥30, or ~ 30 lbs. overweight for 5’ 4” person) No Data <10% 10%–14% 15-19% 20-24% ≥ 25%
Obesity Trends* Among U.S. AdultsBRFSS, 2003 (*BMI ≥30, or ~ 30 lbs. overweight for 5’ 4” person) No Data <10% 10%–14% 15-19% 20-24% ≥ 25%
Obesity Trends* Among U.S. AdultsBRFSS, 2004 (*BMI ≥30, or ~ 30 lbs. overweight for 5’ 4” person) No Data <10% 10%–14% 15-19% 20-24% ≥ 25%
Obesity Trends* Among U.S. AdultsBRFSS, 2005 (*BMI ≥30, or ~ 30 lbs. overweight for 5’ 4” person) No Data <10% 10%–14% 15-19% 20-24% 25-29% ≥ 30%
Obesity Trends* Among U.S. AdultsBRFSS, 2006 (*BMI ≥30, or ~ 30 lbs. overweight for 5’ 4” person) No Data <10% 10%–14% 15-19% 20-24% 25-29% ≥ 30%
Obesity Trends* Among U.S. AdultsBRFSS, 2007 (*BMI ≥30, or ~ 30 lbs. overweight for 5’ 4” person) No Data <10% 10%–14% 15-19% 20-24% 25-29% ≥ 30%
Walkability and your health 4: The Health Belief Model and Physical Activity Why are people getting more overweight? Personal factors Constraints on behavior • Traditional or family foods/eating habits • Other demands on time • Obese parents • Financial situation • Barriers in the environment prevent healthy eating • Barriers in the environment prevent physical activity 32 Adapted from Northern Territory Government Australia. "Health Belief Model." Available at: http://www.nt.gov.au/health/healthdev/health_promotion/bushbook/images/model.gif. Accessed March 2009.
Barriers to walking in the environment • Danger from motor vehicles, crime & violence • Lack of sidewalks or poor repair/design of sidewalks • Aestheticqualitiesof the area (shade, noise, attractiveness of paths) • Existence and quality of facilities for exercise (e.g., parks, sports fields/courts, walking paths, etc) • Distance to destinations
How Assessment Helps • When we assess the pedestrian environment, we can: • Identify problem areas • Identify priorities • Ask the city to focus on our priorities • When we do an on-the-ground assessment we also get to: • Meet our neighbors • Get to know our neighborhood as pedestirans • Eat free food and have a fun day!
PEQI Form: overview • Developed by the SF Dept of Public Health • Street segment + intersection items • Grouped into 5 Domains: • Intersection safety • Traffic • Street Design • Land Use • Perceived safety
How it works • You complete the PEQI form on every street segment and intersection • We enter the data and use them to compute a PEQI score
Identifying your location DO THIS RIGHT.
Intersection Identifiers q y s t r w v bb aa Grace & Double cc u Carson & Dolores p m n o z x dd
Intersection Identifiers Carson 10 1/30/2010 n Carson Dolores
Street Segment Identifiers 59 49 60 2 51 54 50 61 1 52 37 55 53 38 47 48 36 61 46 45 Carson between Grace & Ravenna 56 39 57 35 34 33 32 40 41 43 58 44 42
Segment Identifiers Carson 10 1/30/2010 32 Carson Grace Ravenna
1. Crosswalks • Designated places for pedestrians to cross the street • Heighten driver & pedestrian awareness • X in the box indicating the number of crosswalks
2. Ladder Crosswalks • Crosswalks with large stripes. • Encourage pedestrians to stay within the safer locations • More visible to motorists • X the number of ladder crosswalks present
3a and b. Pedestrian Signal • Tell pedestrians how much time they have to cross, making it easier for them to make smart choices • Count the number of directions that have pedestrian signals WITH countdowns • Count the number of directions that have pedestrian signals WITHOUT countdowns • X the appropriate boxes • Mark both items
4. Stop Signs • Force motorists to slow down • Allow pedestrians more time to cross • Count the number of directions this intersection has stop signs