Some Topics In Multivariate Regression
Some Topics In Multivariate Regression. Some Topics. We need to address some small topics that are often come up in multivariate regression. I will illustrate them using the Housing example. Ton finish the house price sectionConfidence intervals Dummy Variables One sided tests Scale of data

Some Topics In Multivariate Regression
E N D
Presentation Transcript
Some Topics • We need to address some small topics that are often come up in multivariate regression. • I will illustrate them using the Housing example. Ton finish the house price sectionConfidence intervals • Dummy Variables • One sided tests • Scale of data • Functional Form
Woldridge refs • Chapter 1 • Chapter 2.1, 2.2,2.3,2.5 • Chapter 3.1,3.2,3.3,3.4,3.5 • Chapter 4.1, 4.2, 4.5, 4.6 • Chapter 5
1. Confidence Intervals (4.3) • We can construct an interval within which the true value of the parameter lies • We have seen that • P(-1.96 ≤ t ≤ 1.96)=0.95 for large N-K • More generally:
Interval b± tc *se(b) will contain b with (1-a)% confidence. • Where tc is “critical value” and is determined by the significance level (a) and the degrees of freedom (df=N-K) • For the case where N-K is large (>100) and a is 5% then tc = 1.96 • Same as the set of values of beta, which could not be rejected if they were null hypotheses • The range of possible values consistent with the data • A way of avoiding some of the ambiguity in the formulation of hypothesis tests • Formally: A procedure which will generate an interval containing the true value (1-a)% times in repeated samples
2. Dummy Variables • Wooldridge Chapter 7.1-7.4 • Record classifications • Dichotomous: “yes/no” e.g. trial, gender etc • Ordinal e.g. level of education • OLS doesn’t treat them differently • Need to be careful about how coefficients are interpreted • Illustrate with “sex” in the wage regression • Use labour2006.dta and dummy.do • Sex =1 iff female sex=0 iff male
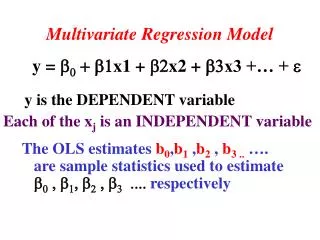
Our basic model is wagei = 1 + 2educi + ui • This can be interpreted a predicting wages based on schooling i.e. E[wagei]= 1 + 2E[educi] • Suspect that wages are systematically different between men and women wagei = 1 + 2educi + 3sexi + ui
Now theprediction becomes: E[wagei]= 1 + 2 E[educi]+ 3 if female E[wagei]= 1 + 2 E[educi] if male • Note that “sex” disappears when it is zero • This translates into separate intercepts on the graph • The extra € for being a woman • Testing if 3 is significant is test of significant difference in wages between the two groups
Interaction • While the intercept could be different the slope could be also • i.e. the degree of discrimination could be different between the two groups • Different returns to education • Model this by an “interaction term” wagei = 1 + 2educi + 3sexi + 4 educi*sexi + ui
Now theprediction becomes: E[wagei]= 1 + (2 + 4 )*E[educi]+ 3 if woman E[wagei]= 1 + 2 E[educi] if man • Note that “sex” disappears when it is zero • This translates into separate intercepts and slopes on the graph • The extra € for bringing a woman and an extra % for each levl of education • Testing if 4 is significant is test of significant difference in return to education between the two groups
3. One Tailed Test (4.2) Need to be careful about the interpretation of the null and alternative Think of example of gender discrimination • State the Hypothesis we want to test H0: bsex >= 0 H1: bsex < 0 • Calculate the test statistic assuming that H0 =0 true. t=-8.33 • Reject null if t<-critical value at chosen sig level • Can reject null as -8.58<-1.64
Which you use is up to you. But • Beware of translating directly from English • Be aware of the implications • Rule of thumb: • H1: “what you expect” e.g. guilt • H0: “what you fear” e.g. innocent • So the test procedure minimizes the prob of rejecting what you fear when it is true • This notion works for a two sided test also
Redo the gender discrimination example from the other side • State the Hypothesis we want to test H0: bsex <= 0 H1: bsex >0 • Calculate the test statistic assuming that H0 =0 true. t=-8.33 • Reject null if t> critical value at chosen sig level • Cannot reject null as -8.58<1.64
The difference between the two • The first H0: bsex >= 0 H1: bsex < 0 • 5% chance of rejecting null when it is correct • i.e. of stating bsex < 0 when in fact bsex >= 0 • i.e. of stating there is discrimination when in fact there is none • The second H0: bsex <= 0 H1: bsex > 0 • 5% chance of rejecting null when it is correct • i.e. of stating bsex > 0 when in fact bsex <= 0 • i.e. of stating there is no discrimination when in fact there is some
4. Scale (2.4 & 6.1) • The scale of the data may matter • i.e. whether we measure consumption in € or €bn or even £ • Basic model: yi = b1 + b2 xi + ei • Change scale of xi : xi* = xi/c • Estimate: yi = b1* + b2* xi*+ ei • b2*= c.b2 • se(b2) = c.se(b2) • Slope coefficient and se change, all other statistics (t-stats, R2, F, etc.) unchanged.
Change scale of yi : yi* = yi/c • Estimate y*i = b1* + b2* xi + ei • b2*= b2 /c • b1*= b1 /c • se(b2) = se(b2)/c • se(b1) = se(b1)/c • t-stats, R2, F unchanged • Both X and Y rescaled yi* = yi/c, xi* = xi/c • Estimate y*i = b1* + b2* x* + ei • If rescaled by same amount: • b1*= b1 /cse(b1) = se(b1)/c • b2 and se(b2) unchanged • t-stats, R2, F unchanged
5. Functional Form (6.2) • Four common functional forms • Linear: qt = a + pt + ut • Log-Log: lnqt = a + lnpt + ut • Semilog: qt = a + lnpt + ut • or lnqt = a + pt + ut • How to choose? • Which fits the data best (cannot compare R2 unless y is same) • Which is most convenient (do we want elasticity, rate of return?) • How trade-off two goals