Download
1 / 37
370 likes | 526 Vues
Development of Retention Treatment Basin for the Treatment of CSOs in Windsor, Ontario, Canada . Canada-Mexico Water Workshop March 30, 2010. Background:. Detroit River Basin:. The Detroit River is about 51.5 km in length.

E N D
Development of Retention Treatment Basin for the Treatment of CSOs in Windsor, Ontario, Canada Canada-Mexico Water Workshop March 30, 2010
Detroit River Basin: • The Detroit River is about 51.5km in length. • It drains 181,300 hectares in Michigan and Ontario; as well as sewer-shed areas.
CSO in Windsor Riverfront Interceptor Sewer LRWRP Windsor CSO Study Area The Riverfront Interceptor Sewer intercepts flows from combined sewers and conveys to the Lou Romano Water Reclamation Plant (LRWRP) for treatment.
Summer 2002 September 7/8, 2009 September 12, 2009 (Pelee Island, Westshore)
Steps and MOE Guideline • A Remedial Action Plan (RAP) has been developed to address water quality concerns in the Detroit River Basin. • One of the main priorities of RAP is to control and reduce pollution from CSOs. • The Ontario Ministry of the Environment (MOE) promulgated Procedure F-5-5 as a means of documenting its objectives for CSO control.( ~ Primary Treatment)
MOE – Procedure F-5-5 • Procedure F-5-5 specifies that: • 90% of wet-weather flow is to be treated to primary treatment equivalency, which is defined as a seasonal average of at least • 50% removal of TSS and • 30% removal of BOD5.
Originally Proposed Solution • A Conventional Retention Treatment basin (CRTB) or a Storage Chamber for controlling CSOs was suggested. • For the storage option (i.e., capture and store - no allowance for treatment), the Storage Chamber volume was calculated to be approximately 106 million gallons (400,000 m3).
Issues that Require Solutions • Not enough space for CRTB or Storage Chamber on the Windsor riverfront. • CSOs contained high proportion of solids with poor settleability. • CRTB or Vortex Separators were unable to meet MOE Procedure F-5-5. • Therefore, an effective treatment technology that requires a small foot-print is required for CSO control.
MOE – Procedure F-5-5 • Furthermore, the seasonal average TSS concentration in the effluentof a treatment system should not exceed 90 mg/Lfor more than 50% of the time for an average year during the seven-month period commencing within 15 days of April 1.
Approach • A high-rate Retention TreatmentBasin(RTB) with chemical coagulation was identified as the preferred approach for CSO treatment. • However, additional information were needed to determine if a high-rate RTB combined with chemical coagulation could be designed for the site that would: • Have a small enough footprint, and • Meet the requirements of the MOE Procedure F-5-5.
Approach(contd..) • Establish the feasibility of using a high-rate RTB in treating Windsor CSO employing coagulation ( with coagulants, such as polymers). • Establish the characteristics of CSOs • Run batch and pilot plant studies • Establish removal efficiencies for pollutants from the CSOs at various surface overflow rates (SORs) • Establish operating conditions and sludge management
Scope • Settling Column Tests • Evaluate settling characteristics of solids with and without chemical addition • Determine appropriate type of polymer and its required dosage based on Jar Test results • Design and construct a Pilot-plant to be used as High Rate RTB • Verify performance characteristics • Develop design parameters for the full scale RTB • Carry out CFD Study to: • Determine the size and geometry of the RTB • Finalize Inlet and Outlet arrangements
Drum with a capacity of 200 L with a mixer Sample pumped from upstream the grit chamber 75 mm Flexible Hose Cylindrical Settling Column H = 3 m F = 200 mm Settling Column 1 Without Polymer Settling Column 2 With Polymer Settling Column Tests Jar Test Schematic Diagram of the Settling Columns Set-up
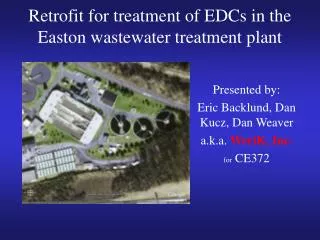
Pilot-Scale Setup The pilot plant of the RTB was constructed at the LRWRP. CSO was pumped from the influent channel of the grit chamber at the LRWRP.
Inlet zone Settling zone Outlet zone 0.65 Influent 0.3 Effluent box (width 0.24) Outlet pipe (200 mm) 3.0 0.6 0.2 0.3 0.1 0.8 Drain Adjustable weir plate (V-notches and launder) Flushing Box Launder B x H = 0.08 x 0.50 Adjustable weir plate (V-notches) Influent channel Outlet baffle Movable baffle 0.30 Perforated baffle 0.40 0.40 0.65 0.40 1.40 0.20 Drain 0.45 Outlet pipe 0.40 0.4 Retention Treatment Basin (RTB) The pilot plant including the RTB was designed to operate at high surface overflow rate, up to 1440 m3/m2.d (60 m/h).
Operating conditions • Two types of cationic polymers were tested (ZETAG) • The RTB were tested for surface overflow rates (SOR) ranged from 6 m/h to 57 m/h. • The performance of the RTB were evaluated by analysing multiple samples for each run The samples were analyzed for: • TSS • BOD • TKN • TP
Optimum Polymer Dose – Percentage of Time Effluent TSS < 90 mg/L
Predicted Flow and solids deposition patterns in model of pilot high-rate RTB with a steep bottom slope
Full-Scale Design of the High Rate RTB • Based on the pilot-scale RTB tests and CFD simulation results, it is suggested to design the full-scale RTB facility using a design SOR of 12,000gpd/ft2 (20 m3/m2•hr). (Conventional RTB basin is typically sized with typical design SORs of 1,200-3,000gpd/ft2 (2-5 m3/m2•hr). • Therefore, the high-rate RTB will only need to be approximately 10-25% of the size of a conventional RTB.
Proposed High Rate RTB Site Proposed RTB Facilities Integrated with the Existing Riverfront Facilities
Acknowledgement • Dr. Jian Li, Stantec • Dr. Ahmed El-Gendy, Assoc. Prof. Ain-Sham University , Egypt • Dr. Alex McCorquodale, Professor, UNO • Mr. Harold Hornec, Stantec • Mr. Ken Ferguson, Ontario Ministry of the Environment • Mr. Paul Drca. City of Windsor • Mr. Kit Woods, City of Windsor • Dr. Jerry Marsalek, Environment Canada • Mr. David Avril of QuestorVeritas Inc • Many other graduate and undergraduate students
Influent Characteristics • The TSS concentration in the influent CSO ranged from 180 mg/L to 300 mg/L,compared to a mean value of 150 mg/L for raw sewage. • The average BOD concentration in the influent CSO was found to be around 100 mg/L . This is compared to a mean value ranged from 140 mg/L to 195 mg/L for raw sewage.
Outlet Zone Inlet Zone Settling Zone Sludge Zone RECTANGULAR SETTLING BASIN
L Type 1 Settling Clarified water H Vf = L Vo H Raw wastewater Q Vf Vo Vf = Q . Vo B H Vo Q = L B H Vo H sludge Top View B 1 4 2 3 Vo = Q . B L Q L Surface loading rate = Q / A = Q / (B x L) = Vo • inlet zone • settling zone • outlet zone • sludge zone L = length B = width H = depth Sectional View