Download
1 / 1
10 likes | 128 Vues
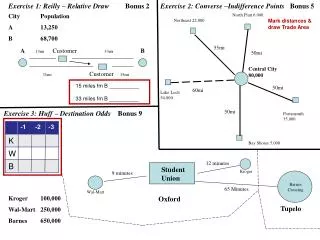
This exercise explores the application of Reilly's Relative Draw and Huff's Destination Odds models to analyze trade areas based on population data. The exercises utilize specific city populations, distances, and travel times to plot customer attraction and trade area boundaries for various retail locations. By calculating the drawing power of different regions, we assess their competitive advantages and potential market reach. Students will gain insights into effective location planning and market analysis using these two essential models in urban studies.

E N D
Exercise 1: Reilly – Relative Draw Bonus 2 Exercise 2: Converse –Indifference Points Bonus 5 City Population A 13,250 B 68,700 North Platt 6.000 Mark distances & draw Trade Area Northeast 22,000 55mi A 13mi Customer 33mi B 50mi Central City 80,000 31mi Customer 15mi 15 miles fm B __________ 33 miles fm B __________ 50mi 60mi Lake Loch 54,000 50mi Exercise 3: Huff – Destination Odds Bonus 9 Portsmouth 35,000 K W B Bay Shores 5,000 12 minutes Student Union Kroger 9 minutes Barnes Crossing 65 Minutes Wal-Mart Kroger 100,000 Wal-Mart 250,000 Barnes 650,000 Oxford Tupelo