Regression-Discontinuity Design
1.45k likes | 1.71k Vues
Regression-Discontinuity Design. Day 2 of Quasi-Experimental Workshop. Agenda. Design Overview Estimation approaches Addressing threats to validity Example 1: Shadish, Galindo, Wong, V., Steiner, & Cook (under review) Example 2: Wong, V., Cook, Barnett, & Jung (2008) Additional issues

Regression-Discontinuity Design
E N D
Presentation Transcript
Regression-Discontinuity Design Day 2 of Quasi-Experimental Workshop
Agenda • Design Overview • Estimation approaches • Addressing threats to validity • Example 1: Shadish, Galindo, Wong, V., Steiner, & Cook (under review) • Example 2: Wong, V., Cook, Barnett, & Jung (2008) • Additional issues • Improving statistical power • Improving generalization of treatment effects across multiple cutoffs, samples, and assignment variables
Design Overview Design Examples Visual depiction Rationales
Regression Discontinuity Resource allocation can be by a merit score, need (or risk) score, first come…, date of birth How prevalent are allocation mechanisms like this in a given society? Some first examples in health are … RD is the design for such circumstances What is it; and why does it have this name? Need to learn the language of an assignment variable, cutoff and outcome
Real Examples of RD Buddelmejer & Skoufias - Progresa in Mexico Ludwig & Miller -Head Start on High School graduation
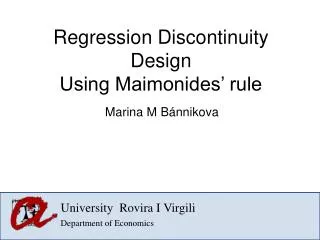
RDD Visual Depiction Comparison
RDD Visual Depiction Comparison Treatment
RDD Visual Depiction Discontinuity, or treatment effect Counterfactual regression line Comparison Treatment
Two Rationales for RDD • Selection process is completely known and can be modeled through a regression line of the assignment and outcome variables • Untreated portion of the AV serves as a counterfactual • It is like an experiment around the cutoff • Benefit: Functional form need not be identified
Two Rationales for RDD • Selection process is completely known and can be modeled through a regression line of the assignment and outcome variables • Untreated portion of the AV serves as a counterfactual • It is like an experiment around the cutoff • Benefit: Functional form need not be identified away from the cutoff
Two Rationales for RDD • Selection process is completely known and can be modeled through a regression line of the assignment and outcome variables • Untreated portion of the AV serves as a counterfactual • It is like an experiment around the cutoff • Benefit: Functional form need not be identified away from the cutoff • Empirically validated by 5 within-study comparisons (Aiken et al., 1998; Buddelmeyer & Skoufias, 2005; Black, Galdo & Smith, 2007; Berk et al., in press; Shadish et al., under review), even though estimands differ and power too
Required Assumptions for RD design • Probability of treatment receipt must be discontinuous at the cutoff. That is, those who receive treatment should b more on one side of the cutoff than the other • No discontinuity in potential outcomes in the cutoff (often referred to as the “continuity restriction”). That is, no alternative interpretation should also show a discontinuity at the cutoff. If so, it would serve as a causal confound.
Threats to Validity in RDD Implementation threats Analytic threats
Implementation Threats to RD Design • Overrides to the cutoff • Sharp design • Fuzzy design • Extreme “fuzziness” with no discontinuity in probability of treatment at cutoff • Manipulation of assignment scores by units
1. Overrides to the cutoff:Sharp, Fuzzy, and “Non-RD” Designs
Sharp RD Designs • Requires that the probability of treatment changes discontinuously from 1 to 0 at the cutoff such that =1. • In practice, this means there are no cross-overs and no-shows in the study. • Parametric, non-parametric, and semi-parametric approaches may be applied for estimating treatment effects. • Treatment effects are identified at the cutoff.
Fuzzy RD Designs • Requires a discontinuity in the probability of treatment at the cutoff such that , but not a 1 to 0 change. • In practice, this means that some individuals either “crossed-over” or did not “show-up” for treatment. • Hahn, Todd, and van der Klaauw (2001) show that when fuzziness occurs, the local average treatment effect (LATE) may be inferred for the subset of individuals who are induced into treatment at the cutoff.
Estimating Treatment Effects in Fuzzy RDDs • LATE is equivalent to the difference in mean outcomes for the treatment and comparison groups (ITT estimate) divided by the difference in treatment receipt rates for both groups within a close neighborhood around the cutoff. • In a regression framework, this is estimated through a two-stage least squared IV approach.
Requirements for Estimating Treatment Effects in Fuzzy RDDs • Similar to how non-compliance is handled in randomized experiments • Requires the following: • That the instrument (treatment assignment) is correlated with treatment receipt; and • That the instrument is not correlated with errors in the outcome model.
“Non”-RD designs • No discontinuity in the probability of treatment at the cutoff. • Occurs when there are so many overrides to the cutoff that the assignment mechanism is meaningless. • Treatment effects cannot be estimated at the cutoff.
Implementation Threats to RD Design • Overrides to the cutoff • Sharp design • Fuzzy design • Extreme “fuzziness” with no discontinuity in probability of treat at cutoff • Manipulation of assignment scores by units
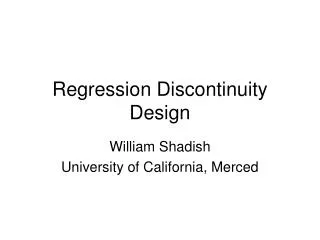
2. Manipulation of the assignment variable • Occurs when participants manipulate assignment scores to receive or avoid treatment. • Different from “overrides to the cutoff” because researcher does not know what scores – and treatment assignment – participants should have received. • No definitive test for knowing when it occurs, but graphical analysis can help detect when it does.
Example: AYP Data from Texas Histogram Kernel Density Plot Drop in density of observations before cutoff Jump in density of observations at the cutoff
Diagnostic test • Can perform “McCrary Test” (2008) • Basically a statistical test for assessing whether there is a discontinuity in the density of observations at the cutoff. • Test is “reassuring” for the analyst, but not sufficient for proving the validity of the design. • Must combine thoughtful consideration of the assignment process with observation of distribution of data around the cutoff.
What to do? • This is a big problem, because there is no work (that we are aware of) for addressing manipulation of assignment process when it occurs. • Can examine qualitatively how manipulation of assignment scores occurred and control for those cases
Analytic Threats to RD Design: Parametric Analyses • Misspecification of the response function
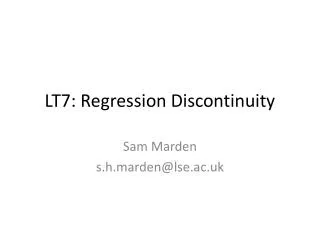
Analytic Threats to RD Design: Misspecification of functional form in Parametric Analyses • Recall, in RDD, we measure the size of the effect as the size of the discontinuity in regression lines at the cutoff:
The size of the discontinuity at the cutoff is the size of the effect.
Nonlinearities in Functional Form • Anything that affects the size of that discontinuity other than treatment is a threat. • In the example, we assumed the relationship between assignment and outcome was linear—regressions are straight lines. • But functional form can be nonlinear due to: • Nonlinear Relationships between the assignment variable and the outcome • Interactions between the assignment variable and treatment.
Functional Form • Put more technically, effects are unbiased only if the functional form of the relationship between the assignment variable and the outcome variable is correctly modeled • Consider first the example of a nonlinear relationship between the assignment variable and the outcome variable:
Here we see a discontinuity between the regression lines at the cutoff, which would lead us to conclude that the treatment worked. But this conclusion would be wrong because we modeled these data with a linear model when the underlying relationship was nonlinear.
If we super-impose a nonlinear regression line1 onto the data, a line that seems to match the curves in the data pretty well, we see no discontinuity at the cutoff anymore, and correctly conclude that the treatment had no effect. 1 In this case, a cubic function (X3)
Functional Form: Interactions • Sometimes the treatment works better for some people than for others • For example, it is common to find that more advantaged children (higher SES, higher pretest achievement scores) benefit more from treatment than do less advantaged children. • If this interaction (between the assignment variable and treatment) is not modeled correctly, a false discontinuity will appear:
Here we see a discontinuity that suggests a treatment effect. However, these data are again modeled incorrectly, with a linear model that contains no interaction terms, producing an artifactual discontinuity at the cutoff…
If we superimpose the regression lines that would have been obtained had an interaction term been included, we would find no discontinuity at the cutoff…
The interpretation of this example is important to understand. The title of the graph says “false treatment main effect”. However, the treatment did have an interaction effect: Treatment helped children with higher scores on the assignment variable more than children with lower scores on the assignment variable…
Here we see an example where the treatment had both a main effect and an interaction effect, correctly modeled. main ^
How to Detect Nonlinearities • Visual Inspection of relationship between assignment and outcome prior to treatment (e.g., if archival data is used). • Visual Inspection of the Graph • Computer Programs (e.g, Cook and Weisberg) • Analysis: Overfitting the model (more on this later).
Adding Nonlinear Terms to the Model • Include nonlinear functions of the assignment variable in the equation, for example: Where d is the treatment indicator and z is the assignment variable • There are many such nonlinear functions, so selecting the correct one is crucial
ˆ ˆ ˆ ˆ = b + b + b - + b - + ( ) ( ) Y d z z d z z e 0 1 2 3 i i i c i i c i Adding Interaction Terms to the Model • One can also add interactions between treatment assignment (d) and the assignment variable (z), for example:
Adding Nonlinear and Interaction Terms to the Model • And one can add both nonlinear and interaction terms to the model: • As you can imagine, the model can get quite large. • Though it may seem complex, all this can easily be done in SPSS, and all the relevant terms can easily be defined with simple SPSS Compute statements.
How Do You Know Which Terms to Add? • If you did a pretest run of the design (before treatment was begun), use that data to model the baseline functional form. • Visually inspect the data for clues about what form seems likely. • Use available programs for curve fitting in order to explore possible functional forms (e.g., Cook & Weisberg, 1994)
Adding Terms, Continued • When in doubt, start by overfitting the model: • Add more polynomial and interaction terms than you think are needed, and then eliminate the nonsignificant ones (from higher order to lower order). • When in doubt, keep terms in the equation; such overfitting will yield unbiased estimates, but will reduce power the more nonsignificant terms are kept.
Adding Terms, Continued • Sensitivity Analyses: Do substantive conclusions vary with different assumptions about which terms to add? • If sample size is large, split the sample in half randomly: • Develop the model on one half • Cross-validate the model on the other half.
Example of Parametric Plot used again later RD data from Shadish, Galindo, Wong, V., Steiner, & Cook (under review) Comparison Treatment
But Parametric Analyses being Replaced by Non-Parametric and Semi-Parametric ones
Non-parametric Approach • Where zi is the assignment score, zcis the cutoff, and Yi are the outcomes. • The limits are often estimated by non-parametric local linear kernel regression. • Treatment effects estimated by examining the size of the discontinuity in the conditional expectation of the outcome given the assignment variable for observations at the cutoff. • Allows analyst to relax assumptions about functional form away from the cutoff.
Non-parametric plotLocal linear kernel regression in STATA RD data from Shadish, Galindo, Wong, V., Steiner, & Cook (under review) Comparison Treatment
3. Semi-Parametric Approach • Where Yi, Di, and Xi are the same as before, and f(Zi) in the generalized additive model is the smooth function of the assignment variable for the control and treatment groups. • The smooth function is typically modeled using a series of splines. • Treatment effect ( ) may be estimated via thin plate regression splines using the mcgv-package in R (R Development Core Team, 2009; Wood, 2006). • Advantage is that it allows for flexibility in modeling the response function while controlling for baseline covariates in the model.