Download

1 / 49
490 likes | 620 Vues
Analytical Tools for Improving Access, Retention and Net Tuition Revenue. College Board Middle States Regional Forum 2008 Daniel J. Rodas, Long Island University Heather Gibbs, Long Island University Jim Scannell, Scannell & Kurz, Inc. Thursday, February 14, 2008. Overview. Key Objectives.

E N D
Analytical Tools for Improving Access, Retention and Net Tuition Revenue College Board Middle States Regional Forum 2008 Daniel J. Rodas, Long Island UniversityHeather Gibbs, Long Island University Jim Scannell, Scannell & Kurz, Inc. Thursday, February 14, 2008
Key Objectives • Increase student access • Improve undergraduate retention • Increase net tuition revenue • Achieve key enrollment objectives • Mission attainment
Long Island University • Founded in 1926 as a private, co-educational, non-sectarian institution • Mission of “Access and Excellence” • 18,600 degree-seeking students • 600 degree and certificate programs • $360 million operating budget • $100 million endowment • $1 billion replacement value/physical assets
Long Island University • Two residential campuses: • Brooklyn • C.W. Post • Four regional campuses • Brentwood • Riverhead • Rockland • Westchester • 653 full-time faculty • 162,000 living alumni
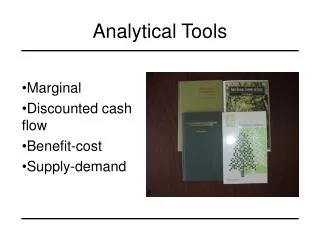
Core Methodologies • Quantitative modeling • Table analysis • Regression • Qualitative research • Document analysis • Interviews • Focus groups • Competitive analysis • Benchmarking of best practices
Case Studies • Undergraduate Pricing and Net Tuition • Graduate Program Review • Retention and Persistence • Discussion
Types • Historical/Incremental • Table Analysis • Predictive modeling & regression • Optimization
Historical / Incremental • Discounts based on historical experience: incremental, benchmarking, trial and error • Tied to a pre-determined discount rate • Works best in a steady state marketplace and stable class characteristics • Problematic under: • Changing market conditions (e.g. competitors raise scholarship offers) • Rapid tuition growth; and/or • Attempts to reconfigure the class profile (e.g. socio-economic, geographic mix, academic ability, etc.)
Optimization Models • Strategic approach to allocating financial aid • Comprises quantitative techniques to understand the relationship between grant and student characteristics on the probability of enrollment • Tools include: • Table analysis • Predictive analysis • Price sensitivity analysis
Table Analysis: Example 1 • Yields for Quality Level B: SAT 1100-1150 • Probability of enrollment does not increase very much from aid between $5,000 - $6,000, and aid > $7,000. *Scannell & Kurz
Table Analysis: Example 2 Financial Need • Grant aid for 220 accepted students with need of $15,000 - $18,000 Scannell & Kurz research 2007
Cost-benefit Analysis Scannell & Kurz research 2007
Cost-benefit Analysis • What if all students in this need bracket received the top financial aid award? • Projected enrollment:220 * 55% = 121 • Projected net tuition revenue:121 * ($20,000 - $10,500) = $1,149,500 • Gain in net tuition revenue:$1,149,500 - $896,500 = $253,000 Scannell & Kurz research 2007
Benefits • $253,000 in additional net tuition revenue • Critical mass • Better residence hall utilization (38 additional students at $4,000 = $152,000) • Improved per unit costs in dining • Bigger enrollment base for future years Scannell & Kurz research 2007
Predictive Modeling and Price Sensitivity Analysis • Goals: • Permits multivariate analysis • Identify factors important in the enrollment decision • Determine the impact of institutional grant on the probability of enrollment • Determine the revenue-maximizing levels of grants • Identify alternative financial aid packaging strategies • Suggest alternative admissions policies Scannell & Kurz research 2007
Predictive Modeling and Price Sensitivity Analysis • Basic Regression equation: • Probability of Enrolling a student = (Student Need, Total Grant, SAT Scores, High School Grade Point Average, and “Other Student Characteristics”) • Collapse Quality into groups: • Quality Group 1: SAT 1300+ and High School GPA 92+ • Quality Group 2: SAT 1200+ and High School GPA 90+ • Quality Group 3: SAT 1100+ and High School GPA 85+ • Quality Group 4: SAT 1010+ and High School GPA 80+ • Quality Group 5: SAT 900+ and High School GPA 80+ • Quality Group 6: all others
Predictive Modeling and Price Sensitivity Analysis • Regression analysis: Scannell & Kurz research 2007
Price Sensitivity Simulation Summary Table #1
Optimization: Summary • Creation of a data file is key • Willingness to create new packaging policies • Is there slack in your system? • May require a radical redefinition of how you package • Test market versus total roll-out • Model needs to be updated/refined annually!
Overview Key Questions Methodology Observations Price Sensitivity Analysis Recommendations Conclusion
Key Questions Is financial aid being used efficiently and effectively in support of enrollment goals? Do recruitment processes ensure sufficient representation of target populations in the applicant pool? Are there appropriate linkages between the programs and their campuses to ensure effective service to doctoral students and a “return on investment” to the University?
Methodology Analysis of data file and departmental records (3 years) Review of off-the-shelf materials In-person interviews and focus groups
Observations Enrollment Goals Admissions Practices Financial Aid Practices Competition Integration with the Campus Summary
Enrollment Goals 16-18 new students admitted annually Faculty interest in increasing class diversity Desire to improve yield on offers of admission Priority to enroll students who will serve “underserved” populations (C.W. Post)
Admissions Practices Little to no active effort to recruit students (primarily “word of mouth”) Inefficient use of Web as recruiting tool Lack of reports regarding Inquiries Little effort to recruit LIU undergrads
Financial Aid Practices Financial Aid offer made after applicant accepts offer of admission Nearly identical level of funding is offered to all enrollees Discount rate declined at both campuses from Fall 2004 to Fall 2006 Yield also declined at both campuses from Fall 2004 to Fall 2006
Financial Aid Practices (cont’d) Brooklyn Campus
Financial Aid Practices (cont’d) C.W. Post Campus
Competition Limited competition between two programs Both compete with some of the same institutions in the region Some comparison and quality measures: % of enrollees receiving tuition waivers or assistantships Average GRE scores U.S. News rankings # of APA approved internship placements
Integration with the Campus Brooklyn program Highly integrated: Students work in Psychological Services Center, which serves campus students Faculty teach at undergrad and master’s level C.W. Post program Largely disconnected Clinic serves general public, not the campus Faculty teach exclusively in the PsyD program
Summary Both campuses: Recruitment resources are notbeing used strategically to meet stated goals Financial Aid resources are not being used strategically to meet stated goals Price sensitivity must be investigated
Price Sensitivity Analysis Brooklyn Campus Net Tuition Revenue by Total GRE Score (2004 to 2006)
Price Sensitivity Analysis (cont’d) C.W. Post Campus Net Tuition Revenue by Total GRE Score (2004 to 2006)
Recommendations Use University’s new PeopleSoft system to capture data beginning at the point of initial inquiry. Follow up with applicants who choose not to enroll in order to better understand the competitive environment. Increase enrollment in each cohort by one or two students. Use the Web more effectively to communicate distinctive program features, including lower cost of 4th year attendance.
Conclusion Institutional investment in its programs is significant. Recruitment efforts and decisions are not always consistent with expressed goals. Institutional resources are not being used strategically to attract and enroll the populations of most interest.
Understanding and Responding to Retention Trends Three Key Questions to Answer • How can we identify at-risk students? • How can we determine the impact of existing policies and programs? • Are there any “image versus reality” issues, fit issues, or service gaps?
Question #1: How Can We Identify At-Risk Students? • Analyze cohort retention and graduation rates by subpopulation. • Develop predictive models to isolate the impact of specific variables.
Cohort Retention / Graduation Rates by Subpopulation • Possible subpopulations to analyze: • Financial aid group (need, income) • Entry statistics (private HS vs. public HS) • Academic Characteristics (SAT/ACT; HS GPA) • Program area • Gender • GPA at institution • Ethnicity • Geography
Cohort Retention / Graduation Rates by Subpopulation Excerpt from Sample Retention Table
Predictive Modeling • If students with Term 1 GPAs below a certain level are very unlikely to retain, build two models: • One to predict who will have a low GPA • One to understand the factors influencing retention of achievers
Predictive Modeling – Excerpt from Sample Predictive Model *For Full Time Freshmen Who Achieved at Least a 2.0 GPA in Term 1
Predictive Modeling • Possible Interventions Based on the Model • Increase on-campus work opportunities • Review residential life programming • Expand program for at-risk students
Question #2: How Can We Determine the Impact of Existing Policies and Programs? • Capture participation data and then compare retention of participants and non-participants. • Be aware of national research on programs that have proven effective. • Conduct pilot programs.
Types of Participation Data to Capture • Athletic involvement • Student organization membership • Honors participants • First-year seminar participants • Work-study participants • Etc.
Question #3: Are There Any “Image Versus Reality” Issues, Fit Issues, or Service Gaps? • Know the national trends (from ACT) and trends among your competitors (from IPEDS). • Analyze student survey responses (NSSE, CSI, SOS, SSI, CIRP, etc.). • Ideally responses would be tied back to student ID. • Conduct focus groups. • Use National Student Clearinghouse data. Note: Feedback loops and measurable goals are critical.