Download
1 / 3
30 likes | 149 Vues
In January 2012, natural gas prices fell to their lowest in a decade, primarily influenced by a mild winter that led to reduced heating demand. This significant decrease in gas usage is reflected in the S/D (supply and demand) graph for natural gas, illustrating the direct correlation between weather patterns and energy consumption. Industry analysts highlight the potential long-term effects on pricing and supply dynamics as demand continues to fluctuate. Edwin Harvey discusses the implications of this trend for consumers and the broader market.

E N D
Natural Gas Hits Decade Low Macroeconomics 2105 Graph S/D (Decrease Gas Usage) WSJ Jan 20, 2012 Student name
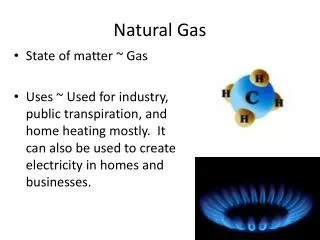
Natural Gas Unusually warm winter results in decreased usage of natural gas for heating S P Price Per Cubic Feet 1 D P 1 2 D 0 Q Q 2 1 Quantity in Cubic Feet Edwin Harvey