Download

1 / 51
510 likes | 537 Vues
This study examines the relationship between plant species richness and ecosystem stability, finding that greater diversity leads to increased stability. Fertilization negatively impacts diversity and ecosystem stability. Structural Equation Modeling reveals mechanisms behind loss of plant diversity with fertilization. Eurasian herbaceous species exhibit competitive advantages in nutrient-rich environments. The relative importance of deterministic versus stochastic community assembly increases with productivity. Results suggest that increasing productivity impacts community structure and diversity differently based on baseline productivity levels.

E N D
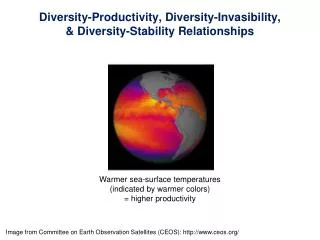
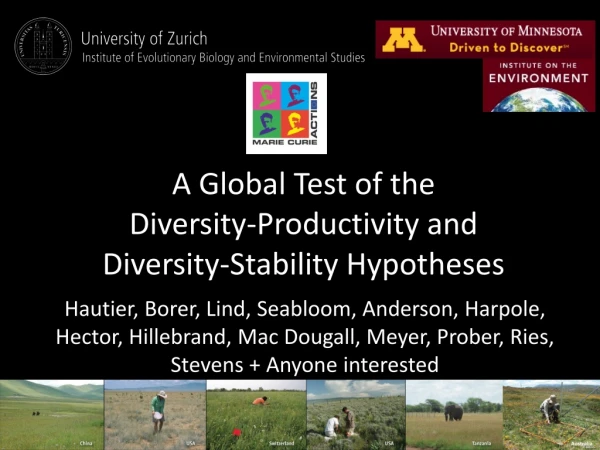
A Global Test of the Diversity-Productivity and Diversity-Stability Hypotheses Hautier, Borer, Lind, Seabloom, Anderson, Harpole, Hector, Hillebrand, Mac Dougall, Meyer, Prober, Ries, Stevens + Anyone interested Australia
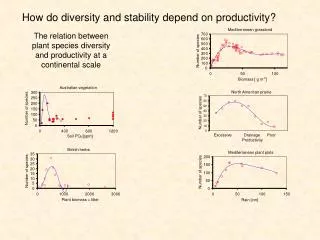
Along the natural diversity gradient represented by 39 herbaceous-dominated plant ecosystems on five continents, plant cover at the species and ecosystem organizational levels was stabilized with increasing plant species richness, as indicated by a decrease of the temporal variability. On average, the plots with the highest diversity were about 40% more stable in time than the plots with the lowest diversity.
Fertilization significantly reduced species richness; on average 1.2 species (SEM = 0.4) were lost with fertilization relative to the controls. Along the reduced diversity gradient plant cover at all organizational levels was not related to species richness. The results support the diversity-stability hypothesis that greater diversity leads to greater ecosystem stability in natural systems and demonstrate that fertilization has negative effect on ecosystem stability.
Global Drivers of Loss of Biodiversity with Eutrophication Hautier, Hector, Anderson, Grace, Seabloom, Borer, Lind, Stevens, Harpole + Anyone interested Australia
Potential mechanisms explaining the loss of plant diversity with fertilization • General increase in the strength of competition – aboveground for light and belowground for nutrients (Grime 1973) • Increase in the strength of abovegroundcompetition for light only (Newman 1973, Tilman 1982) • Acidification (Silvertown et al. 2006) • Accumulation of plant litter (Berendse 1999, Foster et al. 1998, Lamb 2008, Tilman 1993)
Using AMOS we made a Structural Equation Modeling to explain the changes in proportional species richness between the control and NPK+ plots. We found that once we controlled for the covariate “elevation”, proportional richness loss is greatest (1) where light reduction is greatest, and (2) where pretreatment evenness was low. Dead biomass had no effect on the change in species richness as well as other mechanisms such as acidification of competition for nutrients. Elevation Eveness Proportion of total biomass change Proportion of dead biomass change Proportion of change in light Proportion of change in richness
Eurasian herbaceous species are better competitors for nutrients away from home 17 species (8 grasses & 9 forbs); 25 sites: 3 UK, 3 EU, 1 China (native sites), 16 US, 1 CA and 1 AU 3 years of treatments Ran separate analyses for introduced sites with multiple study species or just one species Analyses: Population level: LMEM with temporal autocorrelations-extracted parameter estimates; Community level (only included 10 sites that shared 5 or more study species, 5 in native and 5 in introduced): PERMANOVA and tested study species associations (positive, negative and neutral) pre- and post-treatment. Nutshell: Eurasia herbaceous species are stronger competitors in their away range and consumers likely enable their persistence in native communities. Responses (relative cover) to nutrient additions and consumer treatments differ home and away, and depending on life-form (grass or forb) Nitrogen and phosphorus increase away; no change home Fencing: no change or increase (when nutrients added) at away sites; decrease at home Grass spp. Interactions at sites with 5 or more study species tended to be positive at home but negative away. Where forbs had more negative interactions at home but positive away.
Working title: Relative importance of deterministic vs. stochastic community assembly increases with increasing productivity (experimental)Davies, Melbourne, Chase, NCEAS working group, all data contributors and anyone who is interested. What we see: • By year three, increasing productivity created communities that deviate further from the null than communities (are more nichey) in which productivity was not increased. • Further, the effect varies with baseline productivity: at low productivity sites, increasing productivity does not change community structure, while at productive sites, increasing productivity creates communities that are more deterministic. • Related: increasing productivity reduced beta diversity in some treatments: NPK Other thoughts: • We are hoping that the results will strengthen further in year four. • We plan a second panel of graphs that include some environmental variables like temperature and rainfall that might help further explain what is going on. • It would make sense to report the effects of nutrient addition on alpha and gamma diversity -- an option would be to have this paper follow up the paper that reports these results.
Green=controls, Black=treatments, x-axis=observed productivity in the first year, pre treatment
Dominant plant species drive the ecosystem response to variation in resource availability across a precipitation gradient • Kimberly La Pierre, Dana Blumenthal, Cynthia Brown, Julia Klein, and Melinda Smith • Submission in Summer 2012
Study Sites SGS TGP MIX SGS: Shortgrass Steppe (Shortgrass LTER) MIX: Mixed-grass Prairie (Saline Experimental Range) TGP: Tallgrass Prairie (Konza Prairie LTER)
Plant trait responses to chronic nutrient additions • Kimberly La Pierre and Melinda Smith • Data collected and analyzed • Writing in Summer 2012 • Submission in Fall 2012
short-term Natural Dominants Altered Dominants Control Nitrogen Phosphorus Nitrogen and Phosphorus
Nutrient additions alter invertebrate community structure and feeding strategy • Kimberly La Pierre and Melinda Smith • Data collected and analyzed • Writing in Fall/Winter 2012 • Submission in Spring 2012
N P K 0.522 plant biomass 1 0.311 invertebrate herbivores 2 4 3 0.502 invertebrate predators invertebrate parasitoids TGP Χ2=5.480, df=15, p=0.987, RFI=0.874
Phylogenetic, functional, and plant trait diversity: Examining potential drivers of primary production in herbaceous systems • Network-wide opt-in manuscript • Data collection and analysis in 2012 • Write in Spring 2012
NutNicheA global test of niche destruction and biodiversity loss • Lead: Stan Harpole (opt-in) • Evidence for multiple nutrient limitation • Addition of nutrients to remove limitation = niche destruction • Loss of species with greater numbers of added nutrients • Link to other MS’s: • Hautier, Grace, et al. • Fay et al. 1/2
NutNiche • general pattern, but site variation: not all sites show predicted response • mostly multi/co-limitation (~63%); super-additive (~45%) • mostly not sampling effect (~80% sites multiple additions > single) • different nutrients important for different responses: • max richness effect ≠ max biomass effect • covariates, not much, so far • Status: rough draft • To do: • composition response—get at species tradeoff assumption? • using max trt year (responses over time appear consistent but increase with time) • other? 2/2
N-Gradientfunctional response, critical loads • Lead: Stan Harpole (opt-in) • CBGB, CDCR, SEDG N-gradients • 0,1,5,10 g m-2 yr-1 • General N10 patterns • Status: need to write up soon! • NutNet add-ons: • N-dep collectors • N1 treatments 1/1
Global EcologySS 20: Global Environmental Challenges Require Global Ecological Research • MS for Frontiers • status: some text, outline for ESA panel • to do: synthesize panel results • Meeting Report (like White et al. Bio Lett) • SeSynC proposal • status: draft • to do: develop sociology 1/1
(Opt-out) Answering one of the 3 original NutNet questions:Under what conditions do grazers or fertilization control plant diversity and productivity? NUTRIENTS AND HERBIVORES CONTROL PLANT DIVERSITY AND FUNCTION IN A GLOBAL GRASSLAND EXPERIMENT • This paper’s goal is to examine vertebrate herbivory x nutrient supply on • plant diversity • relative abundance (evenness) • net primary production • within the context of site and regional drivers • climate • soils • regional productivity • regional diversity
Results Fertilization: species richness declined and live biomass increased (p=0.0001 and p=0.001, respectively); Fences: no overall effect on plot-scale richness, evenness, or biomass Inside fences, NPP declines through time, but this effect is counteracted with fertilization Both Bray-Curtis & Jaccard metrics show that species in plots turnover in response to both fertilization and fencing (will also test contingency on site diversity) We will also look at: the association between grassland responses to fencing and fertilization among and within sites (log-ratios) the relationship b/w turnover and change in biomass global-scale predictors (contingencies) – best models of change in richness, evenness, and biomass as a function of soils, climate, and site-level diversity, evenness, NPP (test of Gruner/Bolker model of additivity; Hillebrand contingencies model) Next steps: re-run with current data; make final figures; hone message; write discussion
Biological Invasions (Seabloom et al.) What are the biogeographic patterns of species invasions? • Mainly focuses on observational data • Rejected from PNAS April 2012 – positive reviews but there were concerns about site selection criteria and land use history (e.g., agriculture and grazing) • Currently preparing for submission to Ecology or Global Change Biology (Other suggestions welcome) • Main changes will be adding in land use and grazing data from Cini and Suzanne’s survey, adding in site selection survey data, and removing the bimodal graph.
Biological Invasions (Seabloom et al.) Are native and exotic species functionally distinct? • Nutrient addition caused a loss of 0.6 native species per year but had no effect on exotic diversity • Nutrient addition caused exotic cover to increase 6% per year but had no effect on native cover • Have had first round of reviews by all authors with no major hiccups from anyone • Still a bit undecided about target journal
What are the effects of fertilization and herbivory on spatial and temporal turnover of species composition Damschen , Gruner, Hillebrand, Lind, Wragg, Wright, Yang Adler, Bakker, Cavender-Barres, Dev, Orrock, Sullivan
Three motivating questions NF Y1 Spatial heterogeneity – mean similarity within treated plots relative to mean similarity within control plots C Y1 NF Y3 C Y3 Spatial turnover– mean similarity between treated plots and control plots relative to mean similarity within control plots Temporal Turnover– mean similarity between treated plots in Y1 and Y3 control plots relative to mean similarity within control plots in Y1 and Y3
To do • Re-run with this year’s data • Are lack of effects in Y3 due to limited sample size • Test important question: What controls between site variability • Predictor variables: • Site fertility (Y0 mean productivity) • Site sensitivity (Log response of productivity to trts) • Species Pool • Evenness, site α
Grassland Soil Stoichiometry at the Global Scale • Currently working on a manuscript draft explaining the abundance and stoichiometry of soil organic matter in relation to climate and vegetation using NutNet observational data The distribution of soil stoichiometric ratios is an order of magnitude larger than previously reported Redfield-like ratios for soil; this is largely due to large variation in phosphorous as reflected in C:P and N:P ratios
C and N are highly correlated with little relationship between C and P and N and P despite a previous meta-analysis reporting these relationships • In addition, we see strong relationships between climate (temperature and precipitation) with SOM and very weak relationships between productivity or diversity • These different factors may make it difficult to apply cornerstones of ecological stoichiometry like the Redfield ratio to grassland soils at the global scale
species response to treatments: competition-defense vgrowth-defense Eric Lind Elizabeth Borer Eric Seabloom Peter Adler Jonathan D. Bakker Dana Blumenthal Mick Crawley Kendi Davies Jennifer Firn Dan Gruner Stan Harpole Yann Hautier Helmut Hillebrand Johannes Knops Brett Melbourne Brent Mortensen Anita C. Risch Martin Schuetz Carly Stevens Peter Wragg
Effects of primary production and producer diversity on consumer biomass Lind, Borer, Kay, Wolkovich, Wright, Gruner, Yang, LaPierre, others…. Does primary productivity predict "secondary productivity"?
Native-Exotic Richness Relationship (NERR) • 32 Nutnet sites: ‘native’ grasslands from four regions (Australia, Central, Intermountain, and Pacific. • Four sections: • Scale-dependent relationships between native and exotic richness (four scales: subplot 1m2, plot, site, and region). • Drivers of NR and ER: independent or interactive? [Jenn Firn] • Scale-dependent heterogeneity (Davies et al. 2005, 2007; Melbourne 2006): the impacts of CV on the NERR slope. • Species associations: are species pairs more positively or negatively associated with each other, than expected by chance (Fridley et la. 2004, 2007)? [Joe Bennett]
f frequency Pacific NS Positive slopes Negative slopes Exotic richness (fine-scale 1 m-2) Australia Central Intermountain Native richness (fine-scale 1 m-2)
Plot-level native richness [random intercepts due to site (σ2site), and block within site (σ2block). Full model AICc =2261; simplified model with StepAIC function AICc=2247] Site-level native richness [random intercepts due to region (σ2region), and site within block (σ2site). Full model AICc =273; simplified model with StepAIC function AICc=256] Site-level introduced richness [random intercepts due to region (σ2region), and site within region (σ2site). Full model AICc =236; simplified model with StepAIC function AICc=227] Plot-level introduced richness {random intercepts due to region (σ2region), site within region (σ2site), and block within site within region (σ2plot). Full model AICc =1593; simplified model with StepAIC function AICc=1584
A. Site-level species associations - natives vs. exotics ** ** ** contrasts the proportion of significant asstns that are positive vs those that are negative ** Proportion of significant correlations B. Plot-level species associations - natives vs. exotics
A global study of below-ground allocation patterns in grasslands • Proportional root allocation should decline when growth is limited by above-ground resources (e.g. light), and increase when growth is limited by below-ground resources (e.g. water and nutrients). • Extracted roots from 21 sites (8 more expected this summer) • Plan to do a full analysis and write much of a paper this week (hope that the additional sites do not change the main results substantially)
Specific hypotheses • Proportional root allocation will decline as total production increases • With increasing number of nutrients added • Inside herbivore exclosures (high litter accumulation leading to light limitation) • Flexibility in allocation will decline with decreasing soil moisture availability (interaction between nutrient addition and site-level mean rainfall)
Manuscript 1: Strong abiotic controls over seed removal in a continent-wide study Authors:Orrock, Brudvig, Firn, MacDougall, Yang, Melbourne, Baker, Bar-Massada, Borer, Crawley, Damschen, Davies, Gruner, Kay, Lind, McCulley, Seabloom. Status: analyses completed, ms drafted, submit after current round of comment by co-authors (Ecology is target journal)
Manuscript 2: Contingency in consumer-mediated invasion Objective: examine how the role of consumers in affecting exotic plant abundance varies as a function of abiotic constraints (e.g. temperature, precipitation) Authors: Orrock, Firn, Bakker, Blumenthal, Borer, Brown, Brudvig, Buckley, Chu, Cleland, Cottingham, Crawley, Damschen, Davies, Firn, Frater, Gruner, Kay, Kirkman, Klein, Knops, LaPierre, Leakey, Li, Lind, MacDougall, McCulley, Melbourne, Moore, Morgan, Nelson, Prober, Seabloom, Stevens, Wolkovich, Wright, Yang Status: introduction drafted, analyses in progress. Pending completion of analyses, send discussion draft to co-authors by September, submit ms by November
Manuscript 3: Biofuel potential of three semi-natural grasslands Objective: examine the energy produced by plant biomass derived from grasslands in CA, MO, and SC Authors: Orrock, Watling, Brudvig, Damschen, Borer, Seabloom, Baker Status: analyses need to be re-visited, ms drafted, revise discussion, send to co-authors, then submit (Ecological Applications is target journal)
Working Title: What limits productivity in grasslands worldwide?Co-Leads: Phil Fay, Suzanne Prober, John Knops (opt-out paper) Hypotheses: Nitrogen is a globally significant limitation on productivity at most sites Nitrogen response of Productivity is independent of climate Phosphorus limitation prominent on old, weathered soils Additional nutrient (co-)limitation in some cases/places
Nutrient response to rainfall and temperature MAT.N Chi P=0.003 MAP.N Chi P<0.001 MAP.P Chi P<0.001 MAT.K Chi P= 0.009 • Currently: Fine-tuning hypotheses and statistical models • Investigating covariance of nutrient effects with climate/grazing intensity variables. • Need to investigate soil property effects. Random model: site_code + site_code.year_trt + site_code.block + site_code.year_trt.block + site_code.plot + plot.sy Variance structures: differing variance between sites; differing variance between pots within sites each year
Currently: Fine-tuning hypotheses and statistical models • Investigating covariance of nutrient effects with climate/grazing intensity variables. • Need to investigate soil property effects.
Nutrient response to rainfall MAP*N*P P=0.005, adjusted for grazing coefficient Random model: site_code + site_code.year_trt + site_code.block + site_code.year_trt.block + site_code.plot + plot.sy Variance structures: differing variance between sites; differing variance between pots within sites each year
History of Grazing & Cultivation Survey • Surveys completed for 39 sites • Information from survey • Whether there is grazing currently & when started • Whether or not & when site was cultivated • Management activities w/in plots • What herbivores present & relative abundance in evolutionary, ecological, recent historic times • Timing of influential climatic events • What is the level of current and recent historic grazing (nil, low, medium, high)