A TRAINING WORKSHOP ON STATISTICAL AND PRESENTATIONAL SYSTEM SOFTWARE (SPSS) 18.0 WINDOWS
350 likes | 638 Vues
A TRAINING WORKSHOP ON STATISTICAL AND PRESENTATIONAL SYSTEM SOFTWARE (SPSS) 18.0 WINDOWS. February, 2013 BY: Abdul- Rauf. Introduction. Mathematics is the language of science, data analysis is the language of research As long as there is research, there will be the need to analyze data

A TRAINING WORKSHOP ON STATISTICAL AND PRESENTATIONAL SYSTEM SOFTWARE (SPSS) 18.0 WINDOWS
E N D
Presentation Transcript
A TRAINING WORKSHOP ON STATISTICAL AND PRESENTATIONAL SYSTEM SOFTWARE (SPSS) 18.0 WINDOWS February, 2013 BY: Abdul-Rauf
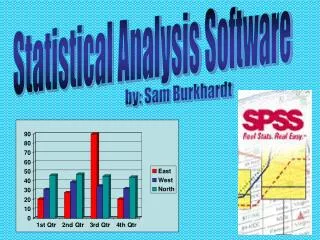
Introduction • Mathematics is the language of science, data analysis is the language of research • As long as there is research, there will be the need to analyze data • SPSS - Statistical and Presentational System Software • SPSS 17 and 18 are called PASW (Predictive Analytics SoftWare) • What is SPSS? • A software package use for conducting statistical analysis, manipulating data, and generating tables and graphs. SeTRAC
Getting to know SPSS • Option 1: • Place your cursor on the SPSS icon and double click • Option 2: • Step 1: Click on Start • Step 2: Move cursor to All Programmes • Step 3: Click on SPSS executable file to open • Step 4: Click on the option under ‘What would you like to do’? • E.g Open existing data source • Step 5: Click OK button SeTRAC
Features of SPSS • The main window features include: • Data Editor • Data view and Variable view • The Viewer • The Pivot Table Editor • Chart Editor SeTRAC
Entering data • Step 1: Click on Data View • Step 2: Click on the first cell (1st C, 1st R) • Step 3: Type in the # e.g. if the variable is ID, then type in 1 • Step 4: Move the cursor into the second cell and enter second piece of information for case # 1 • Step 5: Move the cursor into next cell and enter very piece of information for case # 1 • Step 6: Press the Home key to get back. Use the down arrow to move to the second row and enter data for case #2 SeTRAC
Modifying the data file • To delete a case • To insert a case between existing cases • To delete a variable • To insert a variable between existing variables • To move an existing variable • To sort the data file • To split the data file • To select cases SeTRAC
To insert a variable between existing variables • Step 1: Position your cursor in a cell in the column (variable) to the right of where you would like the new variable to appear • Step 2: Right click • Step 3: Insert variable • Step 4: Enter the data of the new variable SeTRAC
To move an existing variable • Step 1: Create a new empty variable column • Step 2: Click on the variable name of the existing variable you wish to move • Step 3: Click on the Edit menu and choose Cut • Step 4: Highlight the new empty column that you created • Step 5: Click on the Edit menu and choose Paste SeTRAC
Screening and cleaning the data • Data screening process involves a # of steps: • Step 1: Checking for errors • Step 2: Finding the error in the data file • Step 3: Correcting the error in the data file SeTRAC
Checking for errors • Inspect the frequencies for Categorical variables • Click on Analyze • Click on Descriptive Statistics • Click Frequencies • Choose the variable you wish to check (e.g. sex) • Move these into the Variables box • Click on Continue • Click on OK SeTRAC
Checking for errors cont. • Inspect the frequencies for Continuous variables • Click on Analyze • Click on Descriptive Statistics • Click Descriptives • Choose the variable you wish to check (e.g. age) • Move these into the Variables box • Click on Continue • Click on OK SeTRAC
Checking for errors cont. • Step 1: Check your minimum, maximum and means values • Step 2: Check the number of valid and missing cases • Step 3: Check the frequencies fall into each category eg district, community, etc • Step 4: Delete on your keypad SeTRAC
Finding the error in the data file • METHOD 1 • Step 1: Click on the variable name of the variable in which the error has occurred (e.g. a 3 for sex) • Step 2: Click once to highlight the column • Step 3: Click on Edit from the menu across the top of the screen • Step 4: click on Find • Step 5: In the Search for box, type in the incorrect value that you are looking for (e.g 3) • Step 6: Click on Search Forward to continue SeTRAC
Finding the error in the data file • METHOD 2 • Step 1: Click on Analyze, Descriptive Stat. Explore • Step 2: In the Display section click on Statistics • Step 3: Click on e.g. sex and move to Dependent list • Step 4: In the Label cases, choose ID • Step 5: In the Statistics section choose Outliers • Step 6: Click on Continue • Step 7: In the Options section choose Exclude case pairwise • Step 8: Click on Continue and then OK SeTRAC
Correcting the error in the data file • Step 1: Check what value should have been entered for that person • Step 2: Find the variable labelled ID • Step 3: Move down to the case that has the ID # with the error • Step 4: Move across the row until you come to the column of the variable with the error • Step 5: Place the cursor in the cell, type in the correct value SeTRAC
Obtaining frequency for categorical variable • Step 1: Click on Analyze, Descriptive Statistics, Frequency • Step 2: Choose and highlight the categorical variables you are interested in • Step 3: Move these into the Variables box • Step 4: Click on the Statistics button • Step 5: In the Dispersion section tick Minimum and Maximum • Step 6: Click on Continue and OK SeTRAC
Obtaining descr. stat. for continuous variable • Step 1: Click on Analyze, Descriptive Statistics, Descriptives • Step 2: Click on all the continuous variables that you wish to obtain descriptive statistics for • Step 3: Click on the arrow button to move them into the Variables box • Step 4: Click on the Options button • Step 5: Click on mean, standard deviation, minumum, maximum, skewness, kurtosis • Step 6: Click on Continue, and OK SeTRAC
Cross tabulation • Step 1: Click on Analyze, Descriptive Statistics, Cross tabs • Step 2: Click on (sex) • Step 3: Click on Row arrow button to move into Row(s) section • Step 4: Click on (agegp3) • Step 5: Click on Column arrow button to move into Column(s) • Step 6: Click on Cells SeTRAC
Crosstab cont. • Step 7: Click on Expected, Total, Unstandardized • Step 8: Click on Continue • Step 9: Click on OK SeTRAC
Creating graphs e.g. histogram • Step 1: Click on Graphs, Histogram • Step 2: Click on your continuous variable of interest (Total perceived stress) • Step 3: Move it into the Variable box • Step 4: Click on Display normal curve • Step 5: Click on Title to type the desired title • Step 6: Click on Continue and OK SeTRAC
Bar graph • Step 1: Click on Graph, Bar • Step 2: Click on Clustered • Step 3: In the Data in chart are section, click on Summaries for groups of cases • Step 4: Click on Define • Step 5: In the Bars represent box click on Other statistics/summary function • Step 6: Click on the continuous variable (Total perceived stress) • Step 7: Click on categorical variable (agegp3) SeTRAC
Bar graph cont. • Step 8: Click on the arrow button to move it into the Category axis box • Step 9: Click on another categorical variable (sex) • Step 10: Move it into the Define Clusters by box • Step 11: Click on the Options button • Step 12: Remove tick if any from Display groups defined by missing values • Step 13: Click on OK SeTRAC
Creating a scatterplot • Step 1: Click on Graphs, Scatter • Step 2: Click on Simple, Define • Step 3: Click on your dependent variable (Total perceived stress) • Step 4: Click on the arrow to move it into the box labelled Y axis • Step 5: Move your other variable into the box labelled X axis • Step 6: Move categorical variables into the Set Markers by box • Step 7: Click on Title, Continue and then OK SeTRAC
Editing a chart/graph • Step 1: Double click on what you wish to change • Step 2: Click on the title or label you wish to change • Step 3: Click once on the aspect of the chart/graph that you wish to change • Step 4: Click on the button on the menu bar that corresponds to the aspect you wish to change SeTRAC
Non-parametric techniques • There are many techniques of non-parametrics • Chi-square for independence • Mann-Whitney Test • Wilcoxon Signed Rank Test • Kruskal-Wallis Test • Friedman Test • Spearman Rank Order Correlation SeTRAC
Procedure for Spearman’ Rank Order Cor. • Step 1: Click on Analyze, Correlate, Bivariate • Step 2: Click on your two variables (total PCOISS, total perceived stress) • Step 3: Move them into the box marked Variables • Step 4: In the section labelled Correlation Coefficients • Step 5: Click on the option labelled Spearman • Step 6: Click on OK SeTRAC
THE END THANK YOU FOR YOUR ATTENTION SeTRAC