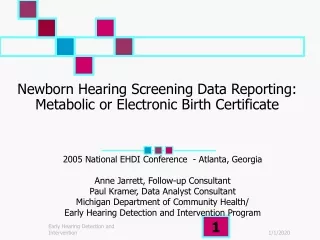
Electronic Birth Certificate Data 2008-2010
This report presents data on cesarean section (C/S) rates from the Hudson Valley Regional Perinatal Center, covering the years 2008-2010. It analyzes primary, repeat, and total C/S percentages by hospital for the year 2010, aligning findings with Healthy People 2020 targets. The data highlights the likelihood of C/S based on various conditions, maternal ethnicity, and gestational age. It also examines NICU admission rates related to delivery methods and maternal factors, providing crucial insights for improving maternal and infant health in the region.

Electronic Birth Certificate Data 2008-2010
E N D
Presentation Transcript
Electronic Birth Certificate Data 2008-2010 Hudson Valley Regional Perinatal Forum Annual Retreat March 18, 2011 The Regional Perinatal Center – Westchester Medical Center Data Source: EBC Data 2008 - 2010
Primary, Repeat and Total (% of Total Deliveries) C/S Rates by Hospital in 2010 * Red line indicates target rate of Healthy People 2020 for Primary C/S (23.9%) Black line indicates NVSR prelim data for 2009 Total C/S (32.9%) * Out of 2806 births at Good Samaritan, n=292 mode of delivery missing (10%)
* * * Indicates non-elective C/S
Dominant Indications for Primary C/S – RPC, years 2008-2010 *Indication for Primary C/S over total # of Primary C/S
Example: a NH White female with Gestational Diabetes has 50.2% chance of receiving a C/S Procedure Preexisting Conditions vs. Pregnancy-Related Conditions (Total C/S)
*e.g., NH Other # primary C/S over Total NH Other deliveries. % of C/S by Ethnicity – RPC 2008-2010 Total % C/S Primary % C/S
* e.g., NH Other at Vassar C/S over all NH Other deliveries at Vassar.
* e.g., NH Other at Vassar Primary C/S over all NH Other deliveries at Vassar.
2010 Total C/S Rate by Race and Gestational Age *69% of All NH Other deliveries at <34wks gestations had C/S
Likelihood of NICU Admittance by Gestational Age and Race Primary C/S Total C/S Of NHO infants born at 34-36wks by C/S, 44.4% were admitted to the NICU *
* *Red line indicates target rate of Healthy People 2020 for breast-feeding (81.9%) *Green line indicates target rate of Healthy People 2010 (75%)
RPC Diet by Delivery Mode and Ethnicity % Birth by Vaginal Delivery % Birth by Cesarean Section (Total C/S) *n=899 (6.2%) of infants had unknown diet
NICU admittance rate by race and bodyweight of the mother * Of NH Black infants born by mothers who were obese, 25.8% were admitted to the NICU
Rate of C/S by Mother’s Age and Race Primary C/S Rate (Primary CS / Total Births) Total C/S Rate (Total CS / Total Births) *