Background: Dry Eye disease
ANCOVA vs ANOVA: Comparing change from baseline between groups in a clinical trial (using SPSS). Background: Dry Eye disease Intact tear film essential for healthy eye. Normal film function requires Adequate production of tears Proper spreading and retention on ocular surface

Background: Dry Eye disease
E N D
Presentation Transcript
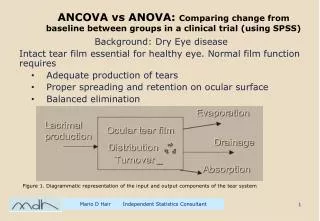
ANCOVA vs ANOVA: Comparing change from baseline between groups in a clinical trial (using SPSS) Background: Dry Eye disease Intact tear film essential for healthy eye. Normal film function requires Adequate production of tears Proper spreading and retention on ocular surface Balanced elimination Figure 1. Diagrammatic representation of the input and output components of the tear system Mario D Hair Independent Statistics Consultant
THE DATA: Tomlinson A, Hair M, McFadyen A. “Statistical Approaches to Assessing Single and Multiple Outcome Measures in Dry Eye Therapy and Diagnosis” The Ocular Surface 2013 Two studies: Khanal et al (2007) & McCann et al (2012) Both Randomised, Parallel , investigator masked Patients with Dry Eye disease randomly assigned into one of two treatment groups Khanal :Oil in water emulsion (25) & Hypromellose (26) McCann :Oil in water emulsion (24) & Sodium Hyaluronate (24) Patients assessed over three measures Evaporation rate: Typically 30 ± 15 10-7g/cm2/s Tear Turnover rate : Typically 9 ± 4 %/min Osmolarity: Typically 310 ± 10 mOsm/l At baseline and again at 30 days Mario D Hair Independent Statistics Consultant
Potential Analysis Comparing change from baseline between groups Two way mixed ANOVA One within group factor (baseline/30 days measures) One between group factor (treatment groups) One way ANOVA: Simple Analysis of change scores (SACS) Dependent : Change over 30 days Independent : Treatment group One way ANCOVA (van Breukelen 2006; Senn 2006) Dependent : Measure at 30 days Independent : Treatment group Covariate: Measure at baseline Multiple Regression Dependent : Measure at 30 days Independent: Measure at baseline & Treatment group Mario D Hair Independent Statistics Consultant
Case study 1: Khanal data Tear turnover Rate (TTR) SACS: One way ANOVA on change Effect size = 24.79/299.37 = 0.083 Conclusion: Significant difference between treatments, Emulsion better, Small effect size. Mario D Hair Independent Statistics Consultant
Case study 1: Khanal data Tear turnover Rate (TTR) One way ANCOVA Conclusion: Significant difference between treatments at 30 days once baseline values are taken into account. Emulsion better, Effect size larger. Mario D Hair Independent Statistics Consultant
ANCOVA: Assumptions 1. Independence of the covariate and treatment effect. (Miller & chapman 2001, Senn 2006) 2. Homogeneity of regression slopes Blue = Emulsion Red = Hypromellose If Homogeneity of slopes is violated Multilevel modelling or Robust Ancova using R (Wilcox 2005) Mario D Hair Independent Statistics Consultant
Case study 2: Khanal data Evaporation rate SACS: ANOVA on change ANCOVA Anova & Ancova No significant treatment effect Mario D Hair Independent Statistics Consultant
Recap • CASE STUDY 1 CASE STUDY 2 • Tear turnover rate: Both ANOVA & ANCOVA Evaporation: Neither ANOVA & ANCOVA • significant : Effect sizes 0.083 0.140 significant • Blue = Emulsion Red = Hypromellose Mario D Hair Independent Statistics Consultant
Case study 3: McCann data Evaporation rate SACS: ANOVA on change Effect size = 0.153 • Conclusion: • Significant difference between treatments, Emulsion better, Small to Moderate effect size. Mario D Hair Independent Statistics Consultant
Case study 3: McCann data Evaporation rate One way ANCOVA • Conclusion: • No significant difference between treatments at 30 days once baseline values are taken into account. Mario D Hair Independent Statistics Consultant
Ancova: Assumptions 1. Independence of the covariate and treatment effect. 2. Homogeneity of regression slopes Blue = HyaluronateRed = Emulsion Problem: baseline mean scores different Mario D Hair Independent Statistics Consultant
Case study 4: Khanal data Tear turnover Rate (TTR) (dealing with outlier) • Recall possible outlier in Emulsion group. • TTR baseline = 7.54, TTR 30 days = 19.04, increase = 11.50. Next highest increase is 6.57 • Standardised residual = 4.47. Options 1: Omit outlier SACS: p = 0.074 Effect size 0.065 ANCOVA p = 0.009 Effect size 0.137 2: Non parametric ANOVA: Kruskal-Wallis p = 0.057 3. Non parametric ANCOVA? Quade (1967), Puri & Sen (1969), Lawson(1983) • Blue = Emulsion Red = Hypromellose Mario D Hair Independent Statistics Consultant
Quade’s Rank analysis of covariance (Quade 1967) • Not explicitly available in SPSS Simplified Procedure. • Rank the dependent variable (TTR2) and covariate (TTR1), using RANK procedure using all the data. • Run a linear regression of the ranks of the dependent variable on the ranks of the covariate, saving the unstandardised residuals using all the data. • Run a one-way analysis of variance (ANOVA), using the residuals from the regression as the dependent variable, and the grouping variable as the factor. The F test resulting from this ANOVA is the F statistic Quade used. Mario D Hair Independent Statistics Consultant
Summary TTR (Khanal): Both ANOVA & ANCOVA significant TTR (Khanal without outlier): Only ANCOVA significant Effect size Anova: 0.083 Ancova:0.140 Effect size Anova: 0.065 Ancova:0.137 Evap (Khanal) Neither ANOVA & ANCOVA significant Evap (McCann): Only ANOVA significant Mario D Hair Independent Statistics Consultant
References • Khanal S, Tomlinson A, Pearce E I, Simmons P A. (2007). Effect of an oil-in-water emulsion on the tear physiology of patients with mild to moderate dry eye. Cornea. 26(2): p. 175-81. • Lawson A. (1983) Rank Analysis of Covariance: alternative Approaches. Journal of the Royal Statistical Society Series D 32(3) 331-337 • McCann LC, Tomlinson A, Pearce E I, Papa V. (2012). Effectiveness of Artificial Tears in the Management of Evaporative Dry Eye. Cornea. Sep 30. Cornea. 31(1):1-5. • Miller G A & Chapman J P.(2001).Misunderstanding analysis of covariance. Journal of Abnormal Psychology, 110(1), 40‐48. • Puri M L & Sen P K (1969) Analysis of covariance based on general rank scores Annals of Mathematical Statistics 40, 610-618. • Quade, D. (1967). Rank analysis of covariance. Journal of the American Statistical Association, 62(320), 1187-1200. • Senn S. (2006), Change from baseline and analysis of covariance revisited. Statistics in Medicine, 25: 4334–4344. • Tomlinson A, Hair M, McFadyen A. Statistical Approaches to Assessing Single and Multiple Outcome Measures in Dry Eye Therapy and Diagnosis. The Ocular Surface 2013. Online publication 10-SEP-2013 doi: 10.1016/j.jtos.2013.05.002 • Van Breukelen G J P (2006) ANCOVA versus change from baseline had more power in randomized studies and more bias in nonrandomized studies J ClinEpidemiol 59 920–925 • Wilcox (2005) Introduction to robust estimation and hypothesis testing (2nded) Burlington MA, Elsevier Mario D Hair Independent Statistics Consultant
Thank you : Any questions? Mario D Hair Independent Statistics Consultant