Statistical Data Editing
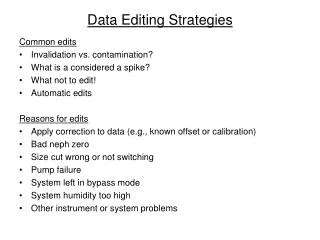
Statistical Data Editing. Anders Norberg, Statistics Sweden (SCB) 2011-11-11. Editing. Editing is an activity of detecting, resolving and understanding errors in data and produced statistics. Selective data editing.

Statistical Data Editing
E N D
Presentation Transcript
Statistical Data Editing Anders Norberg, Statistics Sweden (SCB) 2011-11-11
Editing Editing is an activity of detecting, resolving and understanding errors in data and produced statistics
Selective data editing The purpose of selective data editing is to reduce cost for the statistical agency as well as for the respondents, without significant decrease of the quality of the output statistics.
Papers by my colleague Leopold Granquist • Granquist (1984). On the role of editing. Statistical Review 2 • Granquist (1997). The New View on Editing. International Statistical Review • Granquist and Kovar (1997). Editing of Survey Data: How Much is Enough? In Survey Measurement and Process Quality. Wiley.
If … • we only want information from businesses that we know they have, • and we ask for that information so they understand, • and we motivate them to deliver as good quality in data as possible, • and we help them to avoid accidental errors in answering questionnaires, • then editing would be a minor process!
Where errors are introduced • Errors in raw data delivered by respondents to the statistical agency are typically non-response and measurement errors • Errors in data transmissions • The statistics production process is a mixture of many activities with risks of introducing errors
The role of editing • Quality Control of the measurement process • Find errors (efficient controls) • Consider every identified error as a problem for the respondent to deliver correct data by our collection instrument • Identify sources of error (process data) • Analyse process data – communicate with cognitive specialists • Contribute to quality declaration • Adjust (change/correct) significant errors 3
Types of errors • Obvious errors / Fatal errors • Non-valid values • Item non-response • Data structure- or model errors, total≠sum of components • Contradictions • Suspected data values • Deviation errors (Outliers) • Suspiciously high/low values, data outside of predetermined limits • Definition errors (Inliers) • Many respondent miss-understand a question in the same way • Many respondents fetch data from info-systems with other definitions
Suspected data values Deviation errors • Manual follow-up takes time and is expensive • Few deviation errors have impact on output statistics (low hit-rate, many changes in data have very little impact) Editing must have impact on the output! Remember response burdon !
Suspected data values Definition errors (Inliers) • Difficult to find • Ways to find them: • Combined editing for several surveys • Deep interviews in focus groups • Use statistics from FEQ and from re-contacts with respondents • High proportions of item non-response • Graphical editing • Good examples
The Process Perspective • Audit and improve data collection (measurement instrument and collection process) • and the editing process itself Un-edited data must be saved in order to produced important process indicators, as hit-rate and impact on output!
Process data • Sources of errors = problem for the respondents • Suspicions • Error codes • Manuel actions (accept / amended values) • Automatic actions
Process indicators • Sources of errors (problem for the respondents) • Prop. of flagged units and variables • Prop. of manually and automatically reviewed units and variables • Prop. of amended values and impact of the changes, per variable • Hit-rate for edits
Statistical Production Process Establish needs 1 Plan and design 2 Create and test 3 Collect 4 Prepareand process 5 Analyse 6 Report and communicate 7 survey statistical needs 1.1 Plan and design table plan 2.1 Create and test Measurem. instrument 3.1 Create frame and draw sample 4.1 Classify and code micro data 5.1 Produce statistical values 6.1 Prepare data and statistical values for dissemination 7.1 Affirmcustomer needs 1.2 Plan and designframe/population and sample 2.2 Develop existing and building new production tools 3.2 Handle respondent issues 4.2 Check micro data 5.2 Quality assurance of produced statistics 6.2 produce final output 7.2 Developtable plan 1.3 Plan and designdata collection 2.3 Assure communication between production tools 3.3 Prepare data collection 4.3 Impute for Non-response 5.3 Interpret and explain 6.3 Report and communicate final output 7.3 Identifydata sources 1.4 Plan and designdata processing 2.4 Test production system 3.4 Carry out data collection 4.4 Complement Data set 5.4 Prepare contents for reporting and communication 6.4 handle inquiries 7.4 Examine disclosure 1.5 Plan and designanalysis andreporting 2.5 Carry out pilot test 3.5 Transfer and store data electronically 4.5 Calculate weights 5.5 Establish contents for reporting and communication 6.5 Market final output 7.5 Carry out market process 1.6 Planproduction flow 2.6 Implement production tools 3.6 Establish final observation register 5.6 Designproduction system 2.7 Implement production system 3.7
Statistical Production Process Establish needs 1 Plan and design 2 Create and test 3 Collect 4 Prepareand process 5 Analyse 6 Report and communicate 7 survey statistical needs 1.1 Plan and design table plan 2.1 Create and test Measurem. instrument 3.1 Create frame and draw sample 4.1 Classify and code micro data 5.1 Produce statistical values 6.1 Prepare data and statisticalvalues for dissemination 7.1 Affirmcustomer needs 1.2 Plan and designframe/population and sample 2.2 Develop existing and building new production tools 3.2 Handle respondent issues 4.2 Check micro data 5.2 Qualityassurance of produced statistics 6.2 produce final output 7.2 Developtable plan 1.3 Plan and designdata collection 2.3 Assure communication between production tools 3.3 Prepare data collection 4.3 Impute for Non-response 5.3 Interpret and explain 6.3 Report and communicate final output 7.3 Identifydata sources 1.4 Plan and designdata processing 2.4 Test production system 3.4 Carryout data collection 4.4 Complement Data set 5.4 Prepare contents for reporting and communication 6.4 handle inquiries 7.4 Examine disclosure 1.5 Plan and designanalysis andreporting 2.5 Carry out pilot test 3.5 Transfer and store data electronically 4.5 Calculate weights 5.5 Establish contents for reporting and communication 6.5 Market final output 7.5 Carry out market process 1.6 Planproduction flow 2.6 Implement production tools 3.6 Establish final observation register 5.6 Designproduction system 2.7 Implement production system 3.7
Statistical Production Process Establish needs 1 Plan and design 2 Create and test 3 Collect 4 Prepareand process 5 Analyse 6 Report and communicate 7 survey statistical needs 1.1 Plan and design table plan 2.1 Create and test Measurem. instrument 3.1 Create frame and draw sample 4.1 Classify and code micro data 5.1 Produce statistical values 6.1 Prepare data and statistical values for dissemination 7.1 Affirmcustomer needs 1.2 Plan and designframe/population and sample 2.2 Develop existing and building new production tools 3.2 Handle respondent issues 4.2 Check micro data 5.2 Qualityassurance of produced statistics 6.2 produce final output 7.2 Developtable plan 1.3 Plan and designdata collection 2.3 Assure communication between production tools 3.3 Prepare data collection 4.3 Impute for Non-response 5.3 Interpret and explain 6.3 Report and communicate final output 7.3 Identifydata sources 1.4 Plan and designdata processing 2.4 Test production system 3.4 Carryout data collection 4.4 Complement Data set 5.4 Prepare contents for reporting and communication 6.4 handle inquiries 7.4 Examine disclosure 1.5 Plan and designanalysis andreporting 2.5 Carry out pilot test 3.5 Transfer and store data electronically 4.5 Calculate weights 5.5 Establish contents for reporting and communication 6.5 Market final output 7.5 Carry out market process 1.6 Planproduction flow 2.6 Implement production tools 3.6 Establish final observation register 5.6 Designproduction system 2.7 Implement production system 3.7
Average proportions of costs of sub-processes 2004 Process Proportion of total cost (%) All products Short-period Annual surveys and periodic Respondent service 3.3 3.3 3.4 Manual pre-editing 4.4 3.9 5.1 Data-registrationediting 5.6 5.1 6.5 Production editing 15.3 12.7 18.9 Output editing 3.9 3.4 4.8 Total editing cost 32.6 28.3 38.6
Web data collection Demands: • High hit-rate in electronic questionnaires • System that can measure hit-rate? Question: • Can it be a goal for us to move all editing to electronic data collection?
Expectation on the production editing process at Stat. Sweden • Generic IT-tools • Less IT-maintenance • Easier planning of work and personnel at Data collection units • Better working environments • Methodology studies • Efficient editing methods • Selective/significance editing • Better working environments • Less response burden • Collection and analysis of process data • Continuous improvement of data collection and editing processes • Information for quality declaration of statistics
Impact • Actual impact = w ( y_une – y_edi) for observationk is the impact on domain-totalTify_uneis kept instead of making a review to findy_edi. • Potential impact= w (y_edi – y_pred)is a proxy for actual impact to be used in practice, asy_ediwill not be known until review.y_pred is a prediction (expected value) fory_edi. • Anticipated (expected) impact(per domain, variable, observation) is the product of suspicion and potential impact.
Selective data editing • Construct a score function for prioritizing variables and records. Alternatives: • 1) Potential impact on statistics for records flagged by at least one traditional edit • 2) Sum of expected impact on statistics for variable values flagged as suspected by edits • Norberg, A. et al. (2010): A General Methodology for Selective Data Editing. Statistics Sweden
Selective data editing A procedure which targets only some of the micro data variables or records for review by prioritizing the manual work. Potential impact Flagged 0 1 Suspicion
All data Blue collar workers White collars Payment by the hour Monthly pay Weekly pay Weekly pay Monthly pay Payment by the hour Profession =1 Profession= 2 Profession= 3 Profession=9 Profession=3111 Profession=3480 Profession=3112 Profession=3113 Women Men Predicted (expected) values Edit groups Data / predictor • Time series • Previous value • Forecast • Cross section • Mean/standard error • Median/quartile 21
Suspicion R= Suspicion=R/(TAU+R) Susp
Score function • Local score, by domain d, variable j & observed unit k,l is the anticipated impact related to an appropriate measure of size for the domain/variable, say standard error of estimate. • VIOLINj = weights for variables (j) • CLARINETc = weights for domains by classifications d(c) • OBOEj = adjustment for size of estimated total or its standard error (j) • LScored,j,k,l = Suspicionj,k,l x(Potential impact) x CELLOd(c),j
Score function • Global scores are aggregated local scores by (5) domains, (4) variables, second stage units (3) to one score for each primary unit (2) and finally to (1) respondent. • Methods: sum, sum of squares, sum of local scores truncated by local thresholds, maximum etc. 28
Cut-off or probability sampling? Say that 821 of the total sample (n=4 000) have a score >0. There are two options for manual review: • Cut-off sampling: Score2 >Threshold2, assuming the remaining bias is small • Two-phase sampling: πps-sampling and design-based estimation of measurement errors to subtract from initial estimates Ilves, K. (2010): Probability Approach to Editing. Workshop on Survey Sampling Theory and Methodology, Vilnius, Lithuania, August 23-27, 2010
Evaluation Relative pseudo-bias is a measure of error in output due to incomplete data review
Evaluation Psedobias for PPI relative to the overall price index. Observation units ordered in descending order of impact.
Editing – remaining methodology issues • Fatal errors • Classifying variables • Survey variables • Confidence (respondents and clients) • New and old respondents • Edited in earlier processes • Web-questionnaires • Scanned paper questionnaires • Data and methods for computing predicted values etc. • Homogenous edit groups • Priorities; variables, domains (from the clients perspective) • Score functions • How to decide threshold values • Sampling below threshold • Inference • Data for evaluation
SELEKT 1.1 Raw+edited past (cold) survey data SAS data set Input (hot) survey data Survey specific cold adapter (SAS code) Data preparation Edits Survey specific hot adapter (SAS code) Data preparation PRE-SELEKT Parameter specifications, Analysis of cold data Table of Parameters SNOWDON-X analysis of edits SAS data set AUTOSELEKT Score calculation & record flagging Table of Estimates CLAN estimation software Accepted records Records to FOLLOW-UP Records to IMPUTATION Process data and reports
SELEKT Parameters (in) Give auto-selekt the parameters: %let PATH_sys=C:\SELEKT\1.0; %let PATH_app=C:\SELEKT\Prod\Demo1_Enterprise; %let EDIT_parms=Ent_Parms1; %let EDIT_data=Demo1_Adap_Ent_Inflowdata; %let EDIT_T1_Value=2009; %let EDIT_T2_Value=1; By the parameter table &EDIT_parmsauto-selekt knows what to do.
SELEKT Error list (out) • Identification: • Column name = Variable • Id1 = Identity for respondent[optional] • Id2 = Identity for primary sampling unit (PeOrgnr, CfarNr etc.) • Id3 = Identity for observational unit (Social security number, CN8 for products) • EditNumber = Edit identification, if the edit flags for suspicions or obvious error. • Timestamp = Time when the questionnaire passesselekt • Process data: • EditFlag = 0 = accepted, 1-5 = error flagged • EditSuspicion = Suspicion generated by continuous edits. • Score1 = (Local) Score for respondent[optional] • Score2 = (Local/Global) Score for primary sampling unit [optional] • Score3 = (Global) Score for observational unit [optional] • N_Obs = Number of observations, which have gone through the edit round. • N_Obs_Flagg = Number of error flagged observations in the PSU, on this list • N_PSU = Number of PSU for the respondent, which have passed the edit round • N_PSU_Flagg = Number of error flagged primary sampling units, on this list
Edits EDITEdit identification Type of edit Active Section Internal error message External error message Instruction for data review Un-edited test variable Error flag EDIT GROUP AND ACCEPTANCE REGION Edit identification Edit groupAcceptance range 1 EDIT PRACTICAL SUPPORT Edit identification Standard edit rule Edited test variable Suspicion probability value produced by the SELEKT system 2 3 IMPACT ON STATISTICSSurvey variable Potential impact on statistics KEY Edit identification Survey variable 5 4 FLAGGING OBJECTS