Effective Risk Communication in Patient-Centered Care
230 likes | 280 Vues
Learn evidence-based methods to communicate health risks effectively in patient care decision-making. Discover best practices and techniques to convey risk information clearly using plain language, visuals, and absolute risk data. Key recommendations include using icon arrays, absolute risk reduction, and maintaining consistent denominators for comparisons in risk communication. Enhance your communication skills to improve patient understanding and promote informed decision-making.

Effective Risk Communication in Patient-Centered Care
E N D
Presentation Transcript
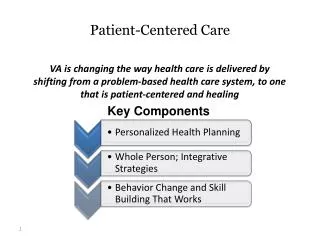
Patient-Centered Care Unit 6: Communicating Health Risk Lecture b – Evidence-Based Methods This material (Comp 25 Unit 6) was developed by Columbia University, funded by the Department of Health and Human Services, Office of the National Coordinator for Health Information Technology under Award Number 90WT0006. This work is licensed under the Creative Commons Attribution-NonCommercial-ShareAlike 4.0 International License. To view a copy of this license, visit http://creativecommons.org/licenses/by-nc-sa/4.0/.
Communicating Health Risk Learning Objectives • Objective 1: Define risk and its importance in patient-centered care and decision-making • Objective 2: Describe the challenges in communicating risks • Objective 3: Describe methods of overcoming those challenges through structured communication and IT
Evidence base for communicating risk information • How should numeric risk estimates be represented? • What are the important elements? • What are best practices? • What are adverse practices known to cause problems and biases? 6.1 Figure (Kukafka, R., 2016). Adapted from Creative Commons.
How to communicate risk information • How best to communicate risk information should be made with care using an evidence-based approach • What the the recommended ways to “nudge” individuals towards better comprehension of risk information?
Summary of recommendations for risk communication to patients • Use plain language to make written and verbal materials more understandable • Provide absolute risks, not just relative risks • Keep denominators constant for comparisons • Consider time frames and lead time bias • Use icon arrays and other visual aids when possible • Make the differences between baseline and treatment risks and benefits clear • Present data using frequencies • Reduce the amount of information shown as much as possible • Provide both positive and negative frames • Provide context and evaluative labels
Communicate using plain language • Plain language refers to materials that are written in a simplified manner so that people of low literacy, eighth grade or lower level of education, can read them and process information • The National Institutes of Health (NIH) has established the Clear Communication Initiative that focuses on achieving health literacy objectives • http://www.cdc.gov/healthliteracy/developmaterials/plainlanguage.html
Provide absolute risks, not just relative risks • Relative Risk Reduction (RRR) • Reduction of risk in the intervention group relative to the risk in the control group • Patients are unduly influenced so should be avoided • Absolute Risk Reduction (ARR) • Difference in risks between two groups • Number Needed to Treat (NNT) • Number of patients who need to be treated (or screened) to prevent one additional adverse outcome • Should be avoided
Provide absolute risks, not just relative risks: example • Relative Risk Reduction (RRR) • New “drug X” decreases risk of cancer occurring from 2 / 100 to 1 / 100 • “50% relative risk reduction” • Absolute Risk Reduction (ARR) • New “drug X” decreases risk of cancer occurring from 2 /100 to 1 /100 • 1% absolute risk reduction
Keep denominators constant for comparisons • A consistent denominator (for example, 1 in 10,000 and 250 in 10,000) should always be used when the task is to compare the chance of occurrence of two or more independent events • It is easier for patients to understand whole numbers (for example, 1 in 10,000) rather than fractions or decimals (.01 in 100) • If risks are very small, larger denominators will be necessary
Consider time frames • It is important to consider the: • Time frame for which the best statistics are currently available • Time frame over which events occur • Time frame that is most understood by patients • The time span chosen can influence both knowledge and risk perceptions
Example of lead-time bias: five-year survival rates in screening versus mortality rates 6.2 Figure: (Wagwarth, Schwartz, Woloshin, et al., 2012)
Use icon arrays and other visual aids when possible • Visual displays such as pictographs / icon arrays and bar charts can improve understanding, especially among the less numerate • When communicating individual statistics, icon arrays are more quickly and better comprehended than other graphical formats • Visuals can help to prevent patients from being biased by other factors
Person icons 6.3 Figure (Kukafka, R., 2016). Used www.iconarray.com.
Make clear the differences between baseline and treatment risks and benefits 6.4 Figure (Kukafka, R., 2016). Used www.iconarray.com.
Use natural frequencies • Suitable formats for presenting numeric chances depend on the nature of the task • When the task is to present the chance of a single event, simple frequency formats that include a number and time interval, such as “every year 10 in 100 people with pre-diabetes develop diabetes”, are more transparent than formats such as the “chance of developing diabetes is 10%” • Natural frequencies are easier to understand than probabilities, suggesting more informed decisions
Reduce the amount of information shown as much as possible • Studies have shown that presenting more information can be distracting and prevent people from focusing on the key pieces of information that is needed for decision-making • It is critical that providers of information think carefully about which information is key and exclude non-critical information • (Peters, Dieckmann, Dixon, et al, 2007)
Provide both positive and negative frames • Gain and loss framing refers to how one describes risks and benefits • For example, the number of people who survive or die, respectively • Research has shown that decisions are sensitive to this information framing • Whenever possible, describe the risks and benefits using both frames • For example, “60% of men who have surgery to treat their prostate cancer will be impotent. This means that 40% of men will not experience impotence”
Provide context and evaluative labels • Risk information providers should provide contextual information when feasible • Context is particularly important for patient decision aids about disease prevention or cancer screening, in which the benefit is a reduction in disease specific mortality • Interpreting the meaning of numeric information (for example, telling patients how good or bad a 9% risk is) can also influence on how patients use that information
Unit 6: Communicating Health Risk, Summary – Lecture b, Methods • The strategies reviewed can be aided through the use of carefully selected patient decision aids and other technology resources • Risk communication and attention to numeracy are important in the era of precision medicine, which uses a data-driven approach to understand patients as individuals rather than group averages • Population will vary considerably in numeracy skills • Health care providers can and should apply best practices to help informed shared decision-making
Unit6 Summary: Communicating Health Risk • Risk information is information about the probability of future outcomes • An important goal of effective risk communication is to facilitate informed shared decision-making • There are challenges to communicating health risk, such as low numeracy, but there are evidence-based best practices that could facilitate communication and informed shared decision-making • Evidence-based best practices to communicate health risk can be aided through the use of carefully-selected patient decision aids and other technology resources.
Communicating Health Risk References – Lecture b References Peters, E, Dieckmann, N, Dixon, A, Hibbard, JH, & Mertz, CK. Less is more in presenting quality information to consumers. Med Care Res Rev. 2007 Apr;64(2):169-90. Charts, Tables, Figures 6.1Figure: Kukafka, R. (2016). Adapted from Creative Commons. Evidence base for communicating risk information. 6.2 Figure: Wegwarth, O, Schwartz, LM, Woloshin, S, Gaissmaier, W, & Gigerenzer, G. (2012). Figure 1. Lead-time bias and overdiagnosis bias. Ann Intern Med. 156(5):340-349. 6.3 Figure: Kukafka, R. (2016). Person icons. Adapted from www.iconarray.com. 6.4 Figure: Kukafka, R. (2016). Incremental risk. Adapted from www.iconarray.com.
Unit 6: Communicating Health Risk, Lecture b – Methods This material was developed by Columbia University, funded by the Department of Health and Human Services, Office of the National Coordinator for Health Information Technology under Award Number 90WT0006.