Download
1 / 18
230 likes | 707 Vues
Representing Acoustics with Mel Frequency Cepstral Coefficients. Lecture 7 Spoken Language Processing Prof. Andrew Rosenberg. Representing Acoustic Information. 16-bit samples 44.1kHz sampling rate ~ 86kB/sec ~5MB/min Waves repeat -- Much of this data is redundant.

E N D
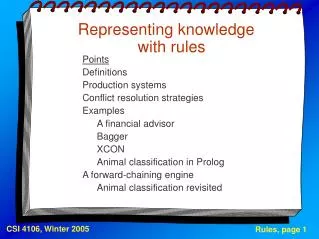
Representing Acoustics with Mel Frequency Cepstral Coefficients Lecture 7 Spoken Language Processing Prof. Andrew Rosenberg
Representing Acoustic Information • 16-bit samples 44.1kHz sampling rate • ~86kB/sec • ~5MB/min • Waves repeat -- Much of this data is redundant. • A good representation of speech (for recognition) • Keeps all of the information to discriminate between phones • Is Compact. i.e. Gets rid of everything else
Frame Based analysis • Using a short window of analysis, analyze the wave form every 10ms (or other analysis rate) • Usually performed with overlapping windows. • e.g. FFT and Spectrogram
Overlapping frames • Spectrograms allow for visual inspection of spectral information. • We are looking for a compact, numerical representation 10ms 10ms 10ms 10ms 10ms
Standard Representation in the field • Mel Frequency Cepstral Coefficients • MFCC FFT Pre-Emphasis window Mel-Filter Bank energy log 12 MFCC 12 ∆ MFCC 12∆∆ MFCC 1 energy 1 ∆ energy 1 ∆∆ energy FFT-1 Deltas 12 MFCC
Pre-emphasis • Looking at spectrum for voiced segments, there is more energy at the lower frequencies than higher frequencies. • Boosting high frequencies helps make the high frequency information more available. • First-order high-pass filter for pre-emphasis.
Windowing • Overlapping windows allow analysis centered at a frame point, while using more information.
Hamming Windowing • Discontinuities at the edge of the window can cause problems for the FFT • Hamming window smoothes-out the edges.
Hamming Windowing • Discontinuities at the edge of the window can cause problems for the FFT • Hamming window smoothes-out the edges.
Discrete Fourier Transform • The algorithm for calculating the Discrete Fourier Transform (DFT) is the Fast Fourier Transform. Australian male /i:/ from “heed” FFT analysis window 12.8ms http://clas.mq.edu.au/acoustics/speech_spectra/fft_lpc_settings.html
Mel Filter Bank and Log • Human hearing is not equally sensitive at all frequency regions. • Modeling human hearing sensitivity helps phone recognition. • MFCC approach: Warp frequencies from Hz to Mel frequency scale. • Mel: pairs of sounds that are perceptually equidistant in pitch are separated by an equal number of mels.
Mel frequency Filter bank • Create a bank of filters collecting energy from each frequency band, 10 filters linearly spaced below 1000Hz, logarithmic spread over 1000Hz.
Cepstrum • Separation of sourceand filter. • Sourcedifferences are speaker dependent • Filterdifferences are phone dependent. • Cepstrum is the “Spectrum of the Log of the Spectrum” – inverse DFT of the log magnitude of the DFT of the signal
Cepstrum Visualization • Peak at 120 samples represents the glottal pulse, corresponding to the F0 • Large values closer to zero correspond to vocal tract filter (tongue position, jaw opening, etc.) • Common to take the first12 coefficients
Deltas and Energy • Energy within a frame is just the sum of the power of the samples. • The spectrum of some phones change over time – the stop closure to stop burst, or slope of a formant. • Taking the delta or velocity and double delta or accelerationincorporates this information
Summary: MFCC • Commonly MFCCs have 39 Features
Next Class • Introduction to Statistical Modeling and Classification • Reading: J&M 9.4, optional 6.6