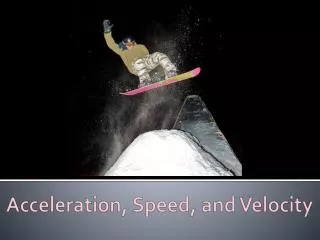
Exploring Speed, Velocity, and Acceleration in Motion Studies
330 likes | 370 Vues
Learn about the concepts of speed, velocity, and acceleration and how they impact an object's position and motion through time. Explore constant speed, changing speed, average speed, velocity, and acceleration, along with motion graphs and experimentation with motion. Discover the relationship between distance, speed, time, and acceleration in this engaging educational resource.

Exploring Speed, Velocity, and Acceleration in Motion Studies
E N D
Presentation Transcript
Speed, Velocity, and Acceleration “I Feel the Need, the Need for Speed!”
Speed • Speed, velocity, and acceleration describe how an object’s position and motion change through time. • Rates measure change in something over a length of time. • Speed is the rate of change of distance over time.
Constant Speed • An object moving at constant speed travels the same distance each second. • This hurdler is moving at a constant speed of 5m/second.
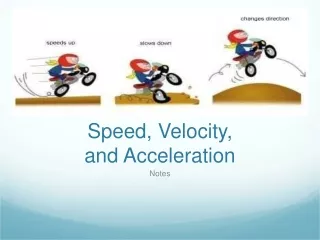
Changing Speed • A car driving in town must slow down and speed up, therefore its speed is not constant. • The car’s speed at any given time is called its instantaneous speed. • An object moving at a constant speed has the same instantaneous speed at all times.
Average Speed • Average speed is the total distance traveled divided by the total time. If you know any 2 of the variables, you can calculate the missing variable. What is the relationship between distance, average speed, and time?
Velocity • Velocity is the speed and direction of a moving object. • Speed is the rate of change of distance with time.
Acceleration • Acceleration is the rate at which velocity changes with time. (Which of these graphs shows positive acceleration? Which shows negative acceleration?) Acceleration
Acceleration (cont’d) • The horses on the carousel are moving at a constant speed, but changing direction, so they are constantly changing velocity and, therefore, accelerating.
Acceleration of falling objects Acceleration caused by gravity is • The same for all objects regardless of mass • 9.8 m/s2
The graph shows an object which is not moving (at rest). The distance stays the same as time goes by because it is not moving. Interpret The Graph Below:
The graph showsthat the objects distance increases as time passes.The object is moving and so it has velocity. The straight line shows it is constant (not changing). Interpret The Graph Below:
Just like the previous graph, this graph shows an object moving with constant velocity Interpret The Graph Below:
In the first part of the graph the object is moving. In the second part of the graph the object is at rest (not moving). In the third part the object is again moving but is returning to the starting position. Interpret The Graph Below:
The curve in the graph shows that the objects velocity is changing as time passes. This is acceleration. Interpret The Graph Below:
Acceleration Graphs Speed (m/s) Speed (m/s) Time (s) Time (s)
The graph showsthat the objects velocity does not change as time passes. It shows constant velocity. Interpret The Graph Below:
The graph showsthat the objects velocity is increasing as time passes – it is accelerating. The straight line shows that it is constant acceleration. Interpret The Graph Below:
Click here for more review: http://www.usoe.k12.ut.us/curr/science/sciber00/8th/forces/sciber/intro.htm
Experimenting With Motion • As a group: List two things that you can change about the motion of a • rolling marble – • ________________________ • ________________________ • As a group: Pick one of the things you can change – • ________________________ • You now have a Research Question: • How can the _________________________ of a rolling marble be changed? • Form a Hypothesis based on what you already know about motion. • (Use an If, Then statement – If __?__ is changed, then__?__ will change)
Use the Experimental Design Graphic Organizer to design an experimentto test your hypothesis.
Questions to consider • What variables need to stay constant? • What tools or information is needed to make the data as precise and accurate as possible