Download
1 / 46
460 likes | 476 Vues
A presentation to the FDA Science Board by Robert M. Califf, MD, emphasizing the importance of biomarkers and imaging in assessing the benefits and harms of chronic disease therapies. The presentation discusses the challenges in clinical trials, the evolving landscape of healthcare consumerism, and the need for cost-effective and evidence-based practices.

E N D
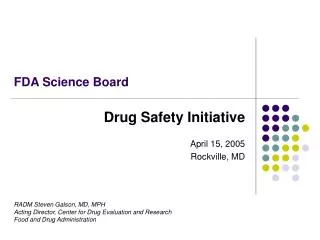
Developing Chronic Disease TherapiesPresentation to the FDA Science Board Robert M Califf MD Director Duke Clinical Research Institute Details in: Health Affairs: 23:77-88; 2004
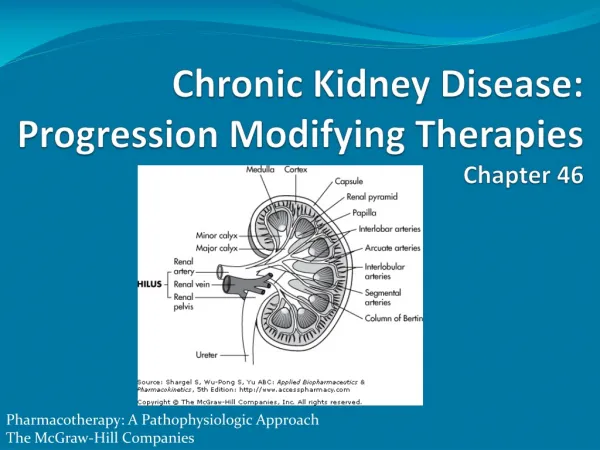
Key Points • Chronic diseases will be (are) the dominant health issue in our society • Predicting whether a chronic disease therapy causes net benefit or harm is difficult • Biomarkers and imaging are the way to go • But mostly as a screen • Cannot substitute for clinical outcomes in most circumstances • Tremendous inefficiency in clinical trials
Life Expectancy Years Years
Age-Standardized Distribution of Disability Manton KG et al. Proc Natl Acad Sci 2001;98:6354-9
Total Number of Persons Age 65 or Older in the United States: 1900-2050 US Census Bureau, Decennial Census Data and Population Projections 80 60 Millions of people 40 Age 65 or older 20 0 1900 1950 2000 2050 * Year *projected
Medicare Growth 2002–2030 • Medicare enrollment 2002: 40 million 2030: 77 million —N Engl J Med 2001;344:928–31 • Worker : beneficiary ratio 2002: 4.0 : 1 2030: 2.3 : 1 2070: 2.0 : 1 —www.whitehouse.gov
Annual Report to Congress, the Medicare Board of Trustees • “The financial status of the fund has deteriorated significantly, with asset exhaustion projected to occur in 2019 under current law compared to 2026 in last year's report.” • Medicare will grow much faster than the economy as a whole, increasing from 2.6 percent of the gross domestic product last year to 3.7 percent in 2010, 7.7 percent in 2035 … • Projected Medicare costs would exceed those for Social Security in 2024 … -- March 23, 2004
Information Technology Employers/Insurance Internet; Scorecards Patient Choice (Cost Sharing) Health Care Consumerism Information development and dissemination Patient demand for service quality, performance Psychodemographics Government Regulators, Purchasers Drivers of Healthcare Consumerism
The Cycle of Clinical Therapeutics—New Model Concept Clinical Trials Guidelines Education and Feedback Outcomes Performance Indicators Performance
Principles for Trials Designed to Define Balance of Risk and Benefit of Therapy • Treatment effects usually modest • Qualitative interactions are uncommon • Quantitative interactions common • Unintended targets common • Long-term vs. short-term effects may differ • Combinations are unpredictable • Class effect may not be valid • Most treatments produce a mixture of benefits and risks • Califf and DeMets Circ 2002
Principles of Trials Designed to Elucidate the Balance of Risk and Benefit of Therapies • Most beneficial therapies do not save money, but create incremental benefit for incremental cost • Applying the results of clinical trials is beneficial • Some areas of CV medicine are underserved and therefore lack evidence to guide practice • Our current method of doing trials is unnecessarily expensive • Participation is critical • Califf and DeMets Circ 2002
Sample Size Pts Randomized Chance of CommentsDeaths (Risk = 10%) Type II Error* on Sample Size 0-50 < 500 > 0.9 Utterly inadequate 50-150 1000 0.7-0.9 Probably inadequate 150-350 3000 0.3-0.7 Possibly inadequate 350-650 6000 0.1-0.3 Probably adequate > 650 10000 < 0.1 Adequate *Probability of failing to achieve p < .01 if risk reduction = 25% Yusuf Progr CV Dis 1985 9503CG01
100 95 90 85 80 0 91 182 273 364 455 Odds of Death 2.64 1.6 4.4 -.5 1 2 3 4 5 CAST Placebo (n = 743) Encainideor Flecainide(n = 755) Patients without Event (%) p = 0.0004 Days after Randomization Echt, N Engl J Med, 1991
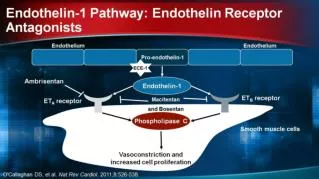
? neurohormones Vesnerinone Systolic Function? Neurohormones Calcium Blockers Arrhythmia PD Inhibitors Neurohormones Epoprostenol Unintended Targets
? neurohormones TNF- blockers Systolic Function? Neurohormones Moxonidine Neurohormones Flosequinon Fluid retention Doxazocin Unintended Targets
Intervention True ClinicalOutcome Fleming and Demets Annals Int Med Disease SurrogateEndpoint Time
Time Disease True ClinicalOutcome A SurrogateEndpoint Intervention True ClinicalOutcome Flemming and Demets Disease B SurrogateEndpoint
Time Intervention Disease True ClinicalOutcome C SurrogateEndpoint Intervention True ClinicalOutcome Flemming and Demets Disease D SurrogateEndpoint
Therapies Always Cause a Combination of: • Good Effects • Bad Effects Adapted from Furberg
Troponin and Risk Stratification in ACS:GUSTO-IIa and TIMI-IIIb TnT - p < 0.001 TnT + Mortality Rates TnT Pos: 14% TnT Neg: 5% p < 0.001 Troponin I (ng/ml) —Antman EM, et al. NEJM 1996 —Ohman EM, et al. NEJM 1996
Combined All-cause Mortality and Morbidity n=5010 Event-free probability 100 95 90 13.3 % risk reduction 85 80 75 Valsartan Placebo 70 P=0.009 65 0 0 3 6 9 12 15 18 21 24 27 Months Cohn, et al. N Engl J Med. 2001.
Subgroup Results Mortality and Morbidity Subgroup % pts Overall 100 Beta blocker (yes) 35 no beta blocker 65 ACEI (yes) 93 no ACEI* 7 .87 .97 .77 RR of death P no ACEI 41% <0.05* ACEI + Beta blocker 42% 0.009 44.0% , P=.0002 *n=366 1.0 1.25 0.50 0.75 Valsartan worse Valsartan better Cohn. N Engl J Med. 2001; *FDA analysis/package insert
Valsartan Approved for CHF(But with 3 subgroup provisos) Indications and Usage Diovan is indicated for the treatment of heart failure (NYHA class II-IV) in patients who are intolerant of ACEIs. In a controlled clinical trial, Diovan significantly reduced hospitalizations for heart failure. There is no evidence that Diovan provides added benefits when it is used with an adequate dose of an ACEI. Concomitant use with an ACEI and a beta blocker is not recommended.
Subgroup analysis: a machine for generating false negatives -- Richard Peto ISIS-2 ASA Placebo RR P Gemini or Libra 11.1% 10.2% 1.09 NS Others 9.0% 12.1% 0.72 <0.00001 Lancet. 1988
Trials n deaths ELITE I 722 49 ELITE II 3,152 530 Vesnarinone 477 46 VEST (60mg) 2,558 534 PRAISE I* 421 119 PRAISE II 1,652 538 RRR p 46% .035 -14% .16 62% .002 -21% .02 46% <.001 -10% .28 .50 1.0 1.5 *(nonischemic only) Small Trials (low number of deaths) are Unreliable
Mortality 1 year-GUSTO 4 22,4 25 18,3 20 15,7 12,8 15 % 9,3 6,9 7 7,9 10 NT-proBNP, quartiles ng/L 4,1 3,8 4,1 5 >1869 3,5 2,7 669- 1869 2,7 1,2 Troponin T, quartiles ug/l 237- 669 0 1,6 > 0.47 <= 237 0.12 - 0.47 0.01 - 0.12 <= 0.01
Mortality 1 year-GUSTO 4 23,4 25 17,2 20 16,7 15 15 % 9 8,1 10 NT-proBNP, quartiles ng/L 7,1 6,4 4,8 4,9 5 3,6 >1869 2,8 2,7 669- 1869 2,7 CRP, quartiles mg/L 0,5 237- 669 0 1,6 >9.62 <= 237 3.96- 9.62 1.84- 3.96 <= 1.84
Mortality 1 year-GUSTO 4 30 25,7 25 16,4 20 12,3 12,2 % 15 8,2 8 NT-proBNP, quartiles ng/L 8,2 6,9 10 6,8 5,2 3,1 >1869 5 2,1 669- 1869 2,9 1,8 1,6 237- 669 0 Creatinine clearance, ml/min 0,3 <=51 <= 237 51-66 66-84 >84
Mortality 1 year 17,8 18 16 14,1 13,8 14 11,6 10,2 12 8,8 8,9 10 % 7,7 7,7 8 5,1 Troponin T, kvartiler ug/l 6,1 5,6 6 5,8 5,1 4 3,2 > 0.47 2 0.12 - 0.47 1,7 0.01 - 0.12 0 >9.62 <= 0.01 3.96- 9.62 CRP, quartiles mg/L 1.84- 3.96 <= 1.84
“Information systems can now draw meaningful statistical inferences pertinent to each individual from massive data sets that include genomic data, imaging results, and biomarker analyses along with traditional clinical variables. Such evidence, made available to clinicians working at the point of care, can direct the most appropriate preventative and therapeutic actions.” —RS Williams, Science, April 2003
Predicting Clinical Benefit and Toxicity • Biomarkers and imaging—the pathway • If we don’t develop effective approaches to “interoperability” of these data we will suffer • Multivariable nature of biology increases needed sample sizes by log orders • No single entity (corporation or institution) has enough cases to validate complex biological predictive models • Allowing the market to “sort it out” is playing Russian roulette with the public health
Background • Estimated $26.4 billion spent annually for R&D, $4.1 billion on Cardiovascular trials • Hypothesis: design of the operational plan impacts overall costs, and operational plans are put together in a risk averse manner • Objective: assess the importance of trials functions to total costs and estimate cost savings through changes in trial design and management
Background - cont’d • Methods - two clinical trials case studies were prepared • participants completed a simple 16 question survey based on budget drivers, not the science • applied a “ballpark” pricing model • “Think-tank” meeting including government agencies, academicians, and industry
Waste in Clinical Trials • Imagine building bridges without engineering schools • Lack of clinical research as a discipline • Lack of standards • Lack of empirical analysis of value of changes
Changes In Lipoproteins Percent Change fromBaseline to Year 1 LDL HDL Triglycerides
HRT Placebo 132 / 1380 122 / 1383 CHD Death 33 / 8506 26 / 8102 290 / 1380 293 / 1383 CHD Death or MI 164 / 8506 122 / 8102 171 / 1380 158 / 1383 Stroke 127 / 8506 85 / 8102 49 / 1380 24 / 1383 DVT/PE 151 / 8506 67 / 8102 49 / 1380 39 / 1383 Breast Cancer 166 / 8506 124 / 8102 HERS 1 2 3 4 WHI HERS/HERS II and WHI: Clinical Outcomes
WHI: HRT and Quality of Life Hayes, N Engl J Med 2003
Hormone Therapy and the Coagulation System Estrogen + Progestin Factor XII Increases ? Factor VIIa Increases Decreases/Neutral Fibrinogen Decreases Decreases F1.2 Increases Increases Fibrinopeptide A Increases ? Protein C Variable Variable Protein S Variable Variable Antithrombin III Decreases Decreases
WHI: Results Interpretation • How large are the treatment effects? • In 10,000 women treated for one year: • CHD 7 more • Stroke 8 more • PE/DVT 8 more • Breast CA 8 more • Colorectal CA 6 fewer • Hip fracture 5 fewer • Cumulative differences will increase with time • 100 excess events over 5 years • 60,000 excess events in 6 million users
Therapies Always Cause a Combination of: • Good Effects • Bad Effects Adapted from Furberg
Key Points • Chronic diseases will be (are) the dominant health issue in our society • Predicting whether a chronic disease therapy causes net benefit or harm is difficult • Biomarkers and imaging are the way to go • But mostly as a screen • Cannot substitute for clinical outcomes in most circumstances • Tremendous inefficiency in clinical trials