Predicting Taste and Odor Events: Is it Possible?
400 likes | 629 Vues
Predicting Taste and Odor Events: Is it Possible?. Andrew R. Dzialowski Department of Zoology Oklahoma State University Donald Huggins Central Plains Center for Bioassessment University of Kansas. What is a taste and odor event?. Occurrence of organic compounds

Predicting Taste and Odor Events: Is it Possible?
E N D
Presentation Transcript
Predicting Taste and Odor Events: Is it Possible? Andrew R. Dzialowski Department of Zoology Oklahoma State University Donald Huggins Central Plains Center for Bioassessment University of Kansas
What is a taste and odor event? • Occurrence of organic compounds • Geosmin – “earth smell” • MIB (2-methylisoborneol) • Low human detection limits • >5-10 parts per trillion (ng/L) • No known effects on human health • Perceived effect on drinking water quality can be high • Expensive to measure!
What are the main producers of T&O compounds? • Blue green algae • Anabaena sp. • Aphanizomensp. • Microcystis sp. • Oscillatoria sp. • Actinomycetes • Much less is known about their impact in Kansas Reservoirs
Common cyanobacteria in Kansas reservoirs Aphanizomenonsp. Microcystissp. Anabaena sp. Oscillatoria
Cyanobacteria • Additional water quality concerns affecting reservoir water quality • Algal toxins • Low dissolved oxygen • Surface scums
Early warning systems • Short window of opportunity to detect and treat an event before complaints come in • Can we use ecological and limnological principles to determine when T&O events are most likely to occur? • How can these tools be implemented and used by water treatment personnel?
Why do cyanobacteria bloom? • Factors affecting abundance • Temperature • Nutrient concentrations (nitrogen and phosphorus) • Water clarity • Reservoir mixing • Can we use changes in these variables to predict blooms?
Predictive models USER-DEFINED UNACCEPTABLE TASTE AND ODOR THRESHOLD (5-10 ng L-1) Geosmin Quality Variable of Concern (QVC) Do Not Treat Treat Predictor variable
Example:Chlorophyll a and geosmin in Cheney Reservoir Treat when Chl a levels exceed 15 ug/L Data from Smith et al. 2002
Water quality model development • Include variables that are relatively easy and cost effective to measure or collect • “Universal model” for all reservoirs in the state? • Models for individual reservoirs or groups of similar reservoirs? • Models do not necessarily imply causation
Reservoir sampling • Sampled five reservoirs of various sizes: Big Hill, Cheney, Clinton, Gardner, and Marion • Reservoirs sampled through the summer, and in some instances into the fall and winter • Several reservoir locations were sampled to account for spatial variation in water quality conditions
Water quality variables • Geosmin • Dissolved Nutrients (nitrogen and phosphorus) • Total Nutrients (nitrogen and phosphorus) • Algal biomass (chlorophyll a and phaeophytin, relative fluorescence, cyanobacterial biomass) • Water Temperature • pH • Specific Conductance • Dissolved Oxygen • Turbidity • Secchi Disk depth
Relationships between TP and chlorophyll a in 5 study reservoirs
Percentage of geosmin samples exceeding human detection in 5 reservoirs
Winter T&O events Temporal Patterns in Geosmin Concentrations
Can we develop a universal model to predict T&O events? A single variable, PO4, explained 30% of the variation in geosmin concentration Treat when PO4 is less than 1.5 Do not treat when PO4 is greater than 1.5
Universal models • Could be used to predict geosmin, but may not be accurate enough to make treatment decisions • What about individual reservoir models?
Big Hill Reservoir • PO4 explained 77 percent of the variation in geosmin. • Individual reservoir model has much greater predictive ability! log10(Geo) = 1.36 - 0.79log10(PO4)
Clinton Reservoir • Secchi disk depth explained 50% of the variation in geosmin High Secchi Disk depths = T&O event
Cheney Reservoir • We were unable to develop a significant model for Cheney Reservoir • However, both the USGS (2006) and Smith et al. (2002) were able to develop models • These results indicate that the factors affecting T&O events vary spatially even within reservoirs • Need multiple years of data to develop accurate models
Predictive geosmin models • Measure predictor variable (e.g. chlorophyll a) • Insert value into spreadsheet formulas • Obtain estimate of geosmin • Make treatment decisions
Water Quality Modeling: Conclusions • Significant models could be developed to estimate geosmin concentrations for most reservoirs • Individual reservoir models appear to be better than universal model for most reservoirs • T&O events were common in reservoirs regardless of nutrient concentrations and throughout the year
Future Water Quality Model Development • Include additional variables in the models • Include water quality data from other investigators • Continue to collect data to improve and refine models • Test the accuracy of models in each reservoir and additional reservoirs
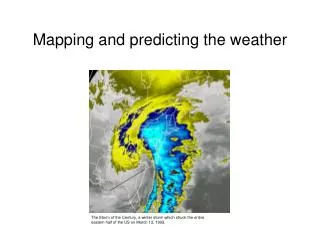
Can we use remotely sensed data to predict T&O events? • Use satellite imagery to monitor the development of algal blooms and T&O events? 1. Landscape characteristics March July Clinton Lake Watershed September
Low turbidity High turbidity 2. Monitor spatial and temporal patterns Example: Differences in turbidity concentrations shown by differences in satellite reflectance values
Cheney Reservoir July 2003 Red areas indicate high chlorophyll (blue-green algae) concentrations in the water. Marion Reservoir April 2003 Marion Reservoir July 2003
Implementation of Models • Drinking Water T&O Workgroup created to help translate research findings into usable treatment strategies • Variable measurement must be rapid (0-5 days) • Data collection and analysis must be cost effective • Test the accuracy of the models • User friendly model structure and data input • Will the reservoir models work with raw water
Implementation (continued) • Algal identification training • Workshops to help distinguish between main T & O producers Anabaena sp. Microcystissp. Aphanizomenonsp.
Implementation(continued) • Water quality kits • Provide “kits” that can be used to sample water that is then sent for immediate analysis of water quality conditions • Collect water quality sample • Overnight to laboratory for processing • Plug values into predictive models to get estimate of geosmin concentrations
Implementation(continued) • Standardized T&O Event Form • Used by all treatment plants in the state • Better understand temporal and spatial dynamics • Compile associated water quality data from state and federal agencies • Determine how big a problem T&O events are in the state (number of plants affected, frequency of events, duration of events)
Future Needs • Documentation of T&O events • More ecological and limnological data associated with T&O events • Extent of the role of Actinomycetes • Assessment of the relationships between remotely sensed watershed and reservoir conditions and measured WQ and T&O variables
In summaryAfter almost 100 years of data collection and analysis, it is clear that both the decay of plant matter as well as release of metabolites and storage products of living microbiota contribute to tastes and odors in water supplies (Sigworth, 1957).“In that same 100 years we seem to have made only limited progress in predicting the when and where taste and odor events will occur but we need to make the research investment” (Huggins and Dzialowski, 2008).
Acknowledgements • Drinking Water Taste and Odor Workgroup • USGS, KDHE, KBS, KGS, KU, USACE • Water managers and others • Kansas Water Office • Tom Lowe, Deb Baker, Kerry Wedel, and Earl Lewis • CPCB researchers • Jason Beury, Niang Choo Lim, Jerry deNoyelles, Debbie Baker This presentationas well as other works on Taste and Odor can be found at www.cpcb.ku.edu under the heading Taste and Odor Workgroup.