Download
1 / 33
330 likes | 356 Vues
Learn how to model processes graphically using Data Flow Diagrams (DFDs) in this detailed guide. From capturing to distributing data, explore principal techniques such as structured English, decision trees, and more. Dive into components of DFDs like process, data flow, data store, source/sink, and arrangement. Discover guidelines for drawing DFDs and leveling data flow diagrams for effective system representation. Enhance your understanding with real-world examples and context diagrams.

E N D
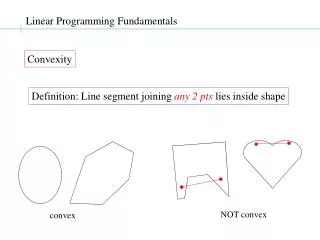
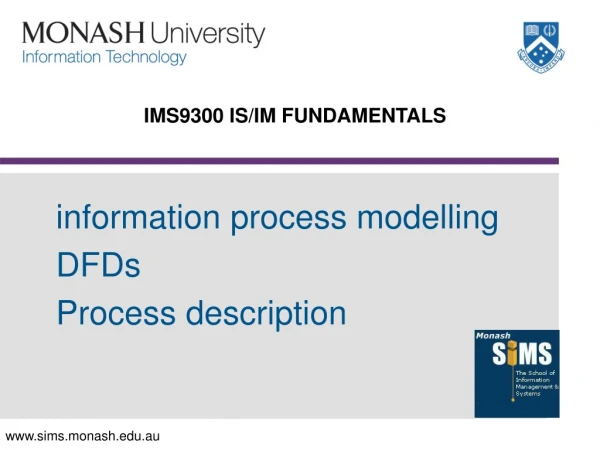
IMS9300 IS/IM FUNDAMENTALS information process modelling DFDs Process description
Process modelling • processes are the “action” part of businesses • process modelling graphically represents the processes which act on data/information to • capture • manipulate • store • distribute
Process modelling • principal techniques • data flow diagrams • associated techniques for modelling the details of low-level processes • structured English: describing the process in simple phrases • decision tables and decision trees: describing the process graphically, especially if the process can have alternative outcomes
Data Flow Diagrams • model the flow of data into, through, and out of an information system • represent an information system as a network of communicating processes • show the processes that change or transform data • show the movement of data between processes • doesn’t show exceptions • doesn’t illustrate sequence
Components of a DFD 2 process data flow data store source/sink arrange Membership loan details Fines Suppliers
Process • represents the work performed which changes data • transforms incoming data flows into outgoing data flows • has a unique number and name 2 arrange membership
Data Flow • represents data in motion • describes a "packet" of data or data that move together • may consist of many individual, related elements that move together to the same destination loan details
Data Store • represents a collection of data flows at rest • has a unique name which should describe the contents of the data store • may represent many different types of physical locations of data • may be a temporary or a permanent repository of data Fines
External Agent • represents an external entity in the environment with which the system communicates • a source if it is an origin of data coming into the system • a sink if it is a destination for data leaving the system Suppliers
External Agent • external agents are outside the system and define its boundaries • what a sink does with data it receives from the system and how a source produces data which it inputs to the system are outside the boundary of the system and are not shown on the data flow diagram • eg. Saltwater Shire Administration
Example Data Flow Diagram Members member details 2.1 record new member Member Member 2.2 Member identification Member number, Member name issue member card purchase order
Guidelines for Drawing DFDs • each object on a data flow diagram must have a unique name • each process must have at least one data flow coming in (input) and at least one data flow going out (output) • the inputs to a process are different from the outputs of that process (and so have different names!) • a process must be able to build its outputs using only the information in its input data flows plus any constant information
Guidelines for Drawing DFDs data flows are permitted: between 2 processes from a data store to a process from a process to a data store from a source to a process from a process to a sink
Guidelines for Drawing DFDs data flows are NOT permitted: • between 2 external agents • between 2 data stores • from an external agent to a data store see page 287 in Hoffer, George and Valacich
Levelling Data Flow Diagrams • any "real" system is too large to represent as a single data flow diagram • the solution is to decompose the system into a hierarchy of levels of processing • the process model of the system then consists of a set of levelled data flow diagrams
Context Diagram • the entire system is represented as a single process • all external agents (sources and sinks) are shown • no data stores are shown: they are inside the boundary of the system SALTWATER LIBRARY
Example Context Diagram Sales Order System sales order Suppliers purchase order goods returned supplier delivery Inventory System goods unavailable notice shipping slip checked supplier invoice Accounts Department Warehouse
Level Zero Diagram • the level zero data flow diagram is the diagram at the level immediately below the context diagram • it "expands" the single process on the context diagram to show the major, high-level processes (or functions) within the system 4.0 levy fines 1.0 arrange membership 2.0 pay bills 3.0 arrange loans
Level Zero Diagram • all external agents (sources and sinks) are included because the level zero diagram, like the context diagram, represents the entire system • the number of each process ends in .0 which corresponds to the level of the diagram: e.g. 1.0, 2.0, 3.0 etc.
Example Level Zero Diagram Order Entry System Suppliers purchase order sales order 2.0 Monitor Stock levels 3.0 1.0 supplier delivery Fill Sales Orders Accept Deliveries out of stock notice Stock file shipping slip Accounts Department checked supplier invoice Warehouse
Levelling DFDs Context diagram 1 2 3 1.1 Level zero diagram 1.2 Diagram 1 (at Level 1)
DFD Exercise 1 Context Diagram – Saltwater Library • External agents • Name the process • Identify the data flows that pass over the boundaries of the system
DFD Exercise 2 Level Zero Diagram – Saltwater Library • Data flows from context diagram • Analyse the business tasks • Identify classes, groups of processes • Name the group of processes • Analyse processes – information required (input), information produced (output) • Identify data stores (resting data)
the processing that occurs within processes in DFDs needs to be defined detailed process descriptions form part of the data dictionary: they define the contents of primitive processes many techniques can be used to define the details of processing: e.g. narrative text, Structured English, decision tables, decision trees, flow charts Process Description
Detailed Process Definitions detailed process descriptions should: • express what the process does (i.e. policy), not how the process is carried out (i.e. procedure) • be in a form that can be easily understood and verified by both users and systems analysts • be in a form that can be easily communicated to all potential stakeholders e.g. end-users, systems analysts, managers, system designers, project leaders, programmers
Example Structured English Accept sales-order Find customer-details If customer-details not found Then reject sales-order Else Create sales-order-header Do while more sales-order-items find item-details calculate sales-order-item price = item price *order-qty Enddo Authorise sales-order Endif
avg account bal > $1,000 overdraft amount Y Y N N Y Y N N < $50,000 previous paid-out Y N Y N Y N Y N loan conditional approval Example Decision Table Y Y Y Y N N N N approve X X X X reject X X X X
wholesale customer retail customer Decision Trees decision trees are an alternative graphical representation of a decision situation as a connected series of nodes and branches 15% local item 10% imported item local item 12% 7% imported item Determine Customer Discount
Selecting Techniques for Process Descriptions • Structured English is useful where a process has a sequence of activities and there is no more than three levels of nesting of decisions • decision trees and decision tables are useful where a process involves a decision based on combinations of values of several conditions
Process Modelling Techniques • models representing: an overview of the system processing the structure of the system processing the flow of data into and out of the processes the detailed logic of the processes can be constructed
References HOFFER, J.A., GEORGE, J.F. and VALACICH (1999) 2nd ed., Modern Systems Analysis and Design, Benjamin/Cummings, Massachusetts. Chapter 1 and 8, WHITTEN, J.L. & BENTLEY, L.D. (1998) 4th ed., Systems Analysis and Design Methods, Irwin, Burr Ridge, Illinois Chapter 1 and 6