Download
1 / 8
80 likes | 262 Vues
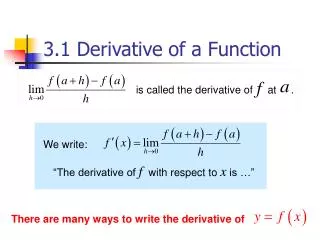
3.1 The First-Derivative Test. Agenda: We develop a technique for sketching curves that uses the derivative. Increasing and Decreasing Functions Definition: A function f ( x ) is increasing on an interval if, for any two numbers in this interval,

E N D
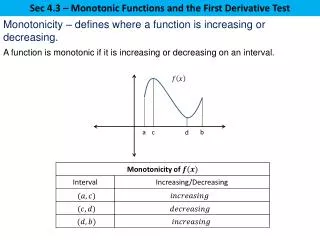
3.1 The First-Derivative Test Agenda: We develop a technique for sketching curves that uses the derivative. Increasing and Decreasing Functions Definition: A function f(x) is increasing on an interval if, for any two numbers in this interval, A function is decreasing on the interval if 1
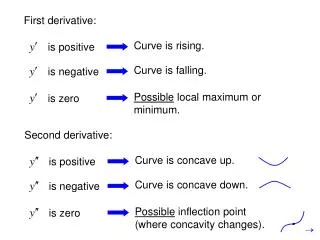
Theorem: A function f(x) is increasing on an interval if its derivative is positive on the interval. A function is decreasing on an interval if its derivative is negativeon this interval. Example: Determine the intervals on which the function is decreasing and increasing. Find its lowest point. Solution: Differentiate the function and determine where the derivative is positive and negative. At x=1 the curve reaches its minimum. Its minimum value is f(1)=0. 2
Definition: A point is called a relative (local) maximum if it has a larger y-value than any point near it. A point is called a relative (local) minimum if it has a smaller y-value than any point near it. Example: Find where the function is increasing and decreasing. Find its relative maximum and minimum points. Solution: Roots of are x=-1,0,2. 3
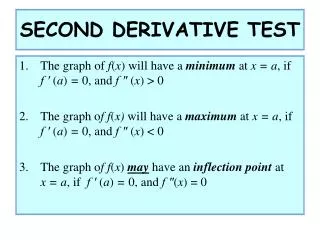
Example (cntd): As in the previous example, local extrema (maxima or minima) demarcate the intervals of increasing and decreasing function. If a function is decreasing to the left of a point andincreasing to the right, the point is a local minimum. If a function is increasing to the left of a point anddecreasing to the right, the point is a local maximum. Thus, in our example, x=-1 is a local minimum; x=0 is a local _________; x=2 is a local _________. We have connected the behavior of the function with the sign of its derivative. So, the above statements can be written more formally: If the derivative changes sign from + to -, then the point is a max. If the derivative changes sign from - to +, then the point is a min. 4
Generally, a function may reach an extreme value not only at a point where its derivative is zero, but also at points where the derivative is not defined, for example, cusps. We need to identify such points as possible extrema as well. Example:y=|x|: plot and find the minimum. It is reached at a cusp! We introduce a notion that includes all points of possible extrema: Definition: A critical value is a number c in the domain of f(x) for which equals zero or does not exist. The points (c,f(c)) are called critical points. Note: Any maximum or minimum point is a critical point, but a critical point is not necessarily an extremum. Example: : determine critical points and the behavior of f 5
First Derivative Test • In order to determine if a given critical value c is a maximum or a minimum of the given function: • Test the derivative with two values of x, one slightly less and one slightly more that c. • If, as x increases, the sign of the derivative changes from + to -, then f(c) is a maximum value and (c,f(c)) is a maximum point. • If the sign changes from - to +, then f(c) is a minimum value. • If the sigh doesn’t change, (c,f(c)) is neither of them. 6
Exercises: Find the extreme values of each function and sketch the curve 7
Homework Section 3.1: 3,7,11,13,15,19,21,23. 8