RNA-SEQ
ESTE ARTICULO ES MUY INTERESANTE HABLA DEL RNA SEQ

RNA-SEQ
E N D
Presentation Transcript
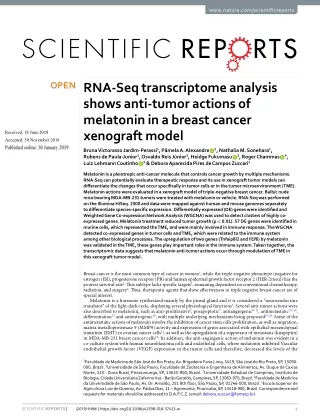
www.nature.com/scientificreports RNA-seq transcriptome analysis shows anti-tumor actions of melatonin in a breast cancer xenograft model opeN Received: 18 June 2018 Accepted: 30 November 2018 Published: xx xx xxxx Bruna Victorasso Jardim-perassi1, pâmela A. Alexandre 2, Nathalia M. sonehara1, Rubens de paula-Junior1, osvaldo Reis Júnior3, Heidge Fukumasu 2, Roger Chammas 4, Luiz Lehmann Coutinho 5 & Debora Aparecida pires de Campos Zuccari1 Melatonin is a pleiotropic anti-cancer molecule that controls cancer growth by multiple mechanisms. RNA-seq can potentially evaluate therapeutic response and its use in xenograft tumor models can differentiate the changes that occur specifically in tumor cells or in the tumor microenvironment (TME). Melatonin actions were evaluated in a xenograft model of triple-negative breast cancer. Balb/c nude mice bearing MDA-MB-231 tumors were treated with melatonin or vehicle. RNA-Seq was performed on the Illumina HiSeq. 2500 and data were mapped against human and mouse genomes separately to differentiate species-specific expression. Differentially expressed (DE) genes were identified and Weighted Gene Co-expression Network Analysis (WGCNA) was used to detect clusters of highly co- expressed genes. Melatonin treatment reduced tumor growth (p < 0.01). 57 DE genes were identified in murine cells, which represented the tMe, and were mainly involved in immune response. the WGCNA detected co-expressed genes in tumor cells and tMe, which were related to the immune system among other biological processes. The upregulation of two genes (Tnfaip8l2 and Il1f6) by melatonin was validated in the tMe, these genes play important roles in the immune system. taken together, the transcriptomic data suggests that melatonin anti-tumor actions occur through modulation of tMe in this xenograft tumor model. Breast cancer is the most common type of cancer in women1, while the triple-negative phenotype (negative for estrogen (ER), progesterone receptor (PR) and human epidermal growth factor receptor 2 (HER-2/neu)) has the poorest survival rate2. This subtype lacks specific targets3, remaining dependent on conventional chemotherapy, radiation, and surgery4. Thus, therapeutic agents that show effectiveness in triple negative breast cancer are of special interest. Melatonin is a hormone synthesized mainly by the pineal gland and it is considered a “neuroendocrine translator” of the light-dark cycle, displaying several physiological functions5. Several anti-tumor actions were also described to melatonin, such as anti-proliferative6, proapoptotic7, antiangiogenic8–11, antimetastatic12–14, differentiation15 and antiestrogenic16, with multiple underlying mechanisms being proposed17,18. Some of the antimetastatic actions of melatonin involve the inhibition of cancer stem cells proliferation, as well as migration, matrix metalloproteinase 9 (MMP9) activity and expression of genes associated with epithelial-mesenchymal transition (EMT) in ovarian cancer cells12, as well as the upregulation of a suppressor of metastasis (kisspeptin) in MDA-MB-231 breast cancer cells14. In addition, the anti-angiogenic action of melatonin was evident in a co-culture system with human neuroblastoma cells and endothelial cells, where melatonin inhibited Vascular endothelial growth factor (VEGF) expression in the tumor cells and therefore, decreased the levels of the 1Faculdade de Medicina de São José do Rio Preto, Av. Brigadeiro Faria Lima, 5419, São José do Rio Preto, SP, 15090- 000, Brazil. 2Universidade de São Paulo, faculdade de Zootecnia e engenharia de Alimentos, Av. Duque de caxias Norte, 225 - Zona Rural, Pirassununga, SP, 13635-900, Brazil. 3Universidade estadual de campinas, instituto de Biologia, Cidade Universitária Zeferino Vaz - Barão Geraldo, Campinas, SP, 13083-970, Brazil. 4faculdade de Medicina da Universidade de São Paulo, Av. Dr. Arnaldo, 251 8th floor, São Paulo, SP, 01246-000, Brazil. 5escola Superior de Agricultura Luiz de Queiroz, Av. Pádua Dias, 11 – Agronomia, Piracicaba, SP, 13418-900, Brazil. Correspondence and requests for materials should be addressed to D.A.P.C.Z. (email: debora.zuccari@famerp.br) 1 Scientific RepoRts | (2019) 9:966 | https://doi.org/10.1038/s41598-018-37413-w
www.nature.com/scientificreports/ proangiogenic factor available for endothelial cells, reducing proliferation, migration and tube formation in the endothelial cells8. Melatonin can also attenuate angiogenesis by reducing TGFβ1, a transforming growth factor-beta1, hypoxia-inducible factor (HIF)-1α, VEGF and its receptor VEGFR2, which was demonstrated in an ovarian cancer DMBA-induced rat model9. HIF-1α and VEGF/VEGFRs reduction by melatonin were also observed in other tumor models19–22. In breast cancer, melatonin efficacy is mainly described in ER-positive breast cancer, such as the MCF-7 cell line, in which physiological doses can exert anti-tumor effects11. The antiestrogenic effect of melatonin was demonstrated in a 7,12-dimethylbenza(a)anthracene (DMBA)-induced mammary tumor model, where mela- tonin treatment increased survival and inhibited the effects of estrone sulfate, a hormone that stimulates tumor growth in ovariectomized rats16. On the other hand, in triple-negative breast tumors, such as the MDA-MB-231 cell line, pharmacological doses of melatonin are needed to exert anti-tumor effects11. In previous studies, our group has shown several anti-tumor effects of melatonin in MDA-MB-231 models10,11,13. Melatonin can effect cells by binding to membrane receptors, MT1 and MT2, which are expressed in a variety of tissues, including breast and immune cells23. Melatonin can also act by receptor-independent mechanisms crossing the membrane and interacting with intracellular proteins and nuclear receptors RZR/ROR (retinoid Z receptor/orphan receptor for retinoid)24, producing antioxidants25,26 and an anti-inflammatory effect27. Both melatonin and its metabolites present important antioxidant properties, which are known to be an action independent of its receptors MT1 and MT2. It can protect melanocytes against UVB-induced reactive oxygen species (ROS) production, stimulating the expression of NRF2 (nuclear factor erythroid 2 [NF-E2]-related factor 2) and DNA-repair through the increase of p53 phosphorylated at Ser-15 expression28. It is known that tumor biology is influenced by the microenvironment and the host immune response4. Immune cells in the tumor microenvironment (TME) can exert ambiguous functions during carcinogenesis, eliminating tumor cells, or, conversely promoting tumor growth29–31. A successful antitumor immune response requires many steps, involving not only the immune cells but also other components of the TME, such as the extracellular matrix (ECM), which serves as a physical barrier to prevent immune infiltration and promote immune escape32. In this context, human tumor xenografts are commonly used to evaluate therapy response, as in these mod- els the tumor growth is dependent on the interplay between the human tumor cells and murine stromal cells33. Athymic nude mice can be used to this purpose, as they have a T cell deficiency, allowing the growth of the xenografted tumor cells34. Although in this model the immunodeficiency is severe, it is not absolute, as the nude mutation allows an intact humoral adaptive immune system and an intact innate immune system35. In addition, despite the deficient immunologic environment, xenograft models preserve other important characteristics of the TME as the ECM, tumor stroma-associations, vascularization and a three-dimensional structure35, mimicking, at least to some extent, the biology in humans34. Currently, RNA-Seq has spread well beyond the genomics community and has become a standard part of the research toolkit36. This technique can be used for different applications, such as the detection of differentially expressed (DE) genes and shows high accuracy. In addition to identifying DE genes, a weighted gene coexpres- sion network analysis (WGCNA) has recently been proposed as a technique to explore the relationship between genes and identify intrinsic modules of coordinately expressed genes37,38. The use of RNA-Seq in xenograft sam- ples can be a useful tool to potentially identify biomarkers and direct changes in response to therapy, distinguish- ing the human tumor cells from the TME, characterized by the murine cells33. Thus, the aim of this study was to perform RNA-Seq transcriptomic analysis to evaluate the pathways involved in the melatonin anti-tumor actions in MDA-MB-231 breast cancer xenograft model. In a previous study, our group showed that melatonin treatment was able to reduce tumor growth in this xenograft model, present- ing anti-angiogenic effects11. Thus, this study was developed to investigate the genome-wide transcriptional anti-tumor melatonin responses in a triple negative breast cancer model, through RNA-Seq analysis. Results Melatonin treatment controls the tumor growth. MDA-MB-231 human breast tumor cells and treated with melatonin (40 mg/kg) or vehicle (control). Treatments were administrated by IP injection 5 days a week for 21 days. Results showed that melatonin treatment reduced the tumor growth when compared with mice treated with vehicle. The mean tumor volume was significantly smaller in the melatonin-treated group from day 18 until day 21 when compared with the control group (p < 0.01; Fig. 1). On day 21, the mean tumor volume was 18.93 ± 5.39mm3 and 75.68 ± 25.83mm3 for melatonin-treated and control groups, respectively. Athymic nude mice were inoculated with De genes by melatonin treatment were detected only in the tMe. First, we aligned each RNA-Seq sample against two reference genomes, human (GRCh37/hg19) and mouse (NCBI37/mm9) separately. Data showed that 57.24% of reads mapped uniquely to human and 29.66% uniquely in mouse, while 11% of reads mapped to both human and mouse genomes and were excluded from further analyses (Supplementary Table S1). A total of 31807 genes were detected for the reads aligned to the human genome, that is, those from MDA-MB-231 cancer cells. Genes were tested for differential expression (Fig. 2), however, only the pseudogene GAPDHP65 was DE after melatonin treatment showing log2 FC -1.07 and padj = 0.01. In mouse cells, which represent the TME, 24719 genes were detected. Of those, 57 genes were DE between melatonin-treated and control groups (adjP < 0.1) (Fig. 3). Of those, 14 genes were downregulated (log2 FC ≤−0.58) and 43 upregulated by melatonin treatment (lod2 FC ≥ 0.58) (Supplementary Table S2). The functional enrichment analysis of GO terms showed that the DE genes of TME were mainly involved in immune system processes and cell motility, such as inflammatory response, regulation of cell motility and leuko- cyte migration, regulation of chemotaxis and chemokine production (Table 1). In addition, pathways enriched 2 Scientific RepoRts | (2019) 9:966 | https://doi.org/10.1038/s41598-018-37413-w
www.nature.com/scientificreports/ Figure 1. Melatonin treatment reduced tumor growth in MDA-MB-231 xenograft model. Tumor volume was monitored by caliper for 21 days. Tumor growth was calculated and compared between groups for each time-point. **p < 0.01; Statistically significant difference between melatonin-treated and control groups using Student’s t-test. Figure 2. Differentially expressed (DE) genes between melatonin-treated and control groups in MDA-MB-231 human breast cancer cells. (A) Correlation analysis of gene expression changes between melatonin-treated samples vs. control samples. The log fold change is plotted on the y-axis and the mean expression of the reads counts is shown on the x-axis. Each point represents a gene. Red points indicate genes called as differentially expressed (DE) at adjusted p value (adjP) ≤ 0.1. (B) Principal component (PC) analysis was performed for the samples using the gene expression values. Experimental group in green represents the melatonin-treated samples. Control group in blue represents the vehicle-treated samples. Scatter plot model of differential gene expression ratios in melatonin-treated breast cancer (blue dots) vs. control (green dots) shows a reasoned discrimination where the distance between dots is a dimensional measure for the similarity of the expression profiles. for DE genes in TME after melatonin treatment included the chemokine signaling, pathways in cancer and Wnt signaling, as shown in Table 2. These results elucidated a potential role of melatonin in the immune response in the TME. Co-expression analysis between control and melatonin-treated groups. The aim of differential connectivity analysis was to uncover differences in gene behavior in two sub-networks, one created by expression data from 5 control tumors and another created by expression data from 5 melatonin-treated tumors. Human and mouse data were analyzed separately. In tumor cells, 714 differentially co-expressed genes were detected between melatonin-treated and con- trol groups (Kdiff> |0.6|). Of those, 331 were highly connected in control tumors, while 383 were highly con- nected in melatonin-treated tumors (Supplementary Table S3). Functional enrichment analysis of GO terms for the highly connected genes in melatonin-treated tumors is shown in Supplementary Fig. S1. For the control 3 Scientific RepoRts | (2019) 9:966 | https://doi.org/10.1038/s41598-018-37413-w
www.nature.com/scientificreports/ Figure 3. Differentially expressed (DE) genes between melatonin-treated and control groups in mouse cells, characterized as the tumor microenvironment (TME). (A) Correlation analysis of gene expression changes between melatonin-treated samples vs. control samples. The log fold change is plotted on the y-axis and the mean expression of the reads counts is shown on the x-axis. Each point represents a gene. Red points indicate genes called as differentially expressed (DE) at adjusted p value (adjP) ≤ 0.1. (B) Principal component (PC) analysis was performed for the samples using the gene expression values. Experimental group in green represents the melatonin-treated samples. Control group in blue represents the vehicle-treated samples. Scatter plot model of differential gene expression ratios in melatonin-treated breast cancer (blue dots) vs. control (green dots) shows a reasoned discrimination where the distance between dots is a dimensional measure for the similarity of the expression profiles. tumors, the 331 connected genes were enriched to cytokine binding and cellular component major histocom- patibility complex (MHC) protein complex, suggesting an association with the immune system (Supplementary Fig. S2). Interestingly these connected genes from control tumors were also enriched for signaling pathways related with immune response, such as “Antigen processing and presentation”, “Allograft rejection” and “Acute graft-versus-host disease”, as well as the cell adhesion molecules (CAMs) pathway, which plays a critical role in the immune response (Supplementary Table S4). For the TME, 13899 genes passed the quality control for the co-expression analysis. 1345 genes were iden- tified as differentially co-expressed in the TME between melatonin-treated and control groups. Of those, 1047 were highly connected in the control group, while 298 were highly connected in melatonin-treated tumors (Supplementary Table S5). Highly connected genes in the melatonin-treated group were enriched to processes related with the inhibition of cellular processes, such as “negative regulation of cellular process” and “negative regulation of RNA metabolic process” (Supplementary Fig. S3). Interestingly, the opposite was observed for the 1047 connected genes in the control group. Most of the biological processes enriched for the control group were those negatively regulated in the melatonin-treated group, suggesting that melatonin treatment is counteracting the pro-tumor cellular pro- cesses (Supplementary Fig. S4). In addition, the “protein processing in endoplasmic reticulum” pathway was also enriched in the control group, suggesting high cellular activity, consistent with cell proliferation and tumor growth. Module preservation analyses between control and melatonin-treated groups. Gene members of the same module are supposed to work cooperatively in related pathways or be under the control of a com- mon set of transcription factors. Thus, 10 gene modules of co-expressed and highly interconnected genes were identified in human tumor cells. Of those, three modules (pink, magenta, and black) were discovered to show weak to moderate preservation, which may indicate that melatonin is acting on these gene sets (Fig. 4A). The pink module was composed of 48 genes, magenta was composed of 45 genes and black was composed of 62 genes (Supplementary Table S6). Genes of each individual module were tested for functional enrichment analyses. Genes from the black module showed enrichment for the cellular component nuclear matrix (Supplementary Fig. S5A), while genes from magenta module were enriched to intracellular-membrane organelle (Supplementary Fig. S5B) and 5 genes were involved in the metabolic pathway. In the TME cells, 39 modules were found and because of the high number of modules identified, they were grouped using a threshold of 90% correlation between the expression of the modules, resulting in a total of 16 co-expressed gene modules. Of those, three modules (darkolivegreen, yellowgreen and orangered) were strongly associated with melatonin treatment in the TME (Fig. 4B), as they showed weak to moderate preservation. These modules were composed of 49, 41 and 30 genes for darkolivegreen, yellowgreen and orangered, respectively (Supplementary Table S7). Genes from the darkolivegreen module were enriched to processes related to posttranscriptional regulation of gene expression (Supplementary Fig. S6), while those from yellowgreen module were enriched to “Positive 4 Scientific RepoRts | (2019) 9:966 | https://doi.org/10.1038/s41598-018-37413-w
www.nature.com/scientificreports/ Entrez Gene 14063 13511 353156 11629 20293 17392 11815 18750 17242 69769 13024 15959 13874 16678 54448 18619 244332 14778 Numbers corresponding to biological processes 1-2-3-4-5-6-7-9-10-11-13-14 1-16 1-3-4-5 1-2-3-4-5-6-7-8-9-10-16 1-2-6-7-8-9-12-13-14 1-3-4-5-16 1-2-3-4-5-6-11-12-13-14-15 1-2-3-4-5-6-7-9-10-12-13-14-15 1-3-4-5-14 2-12-13-14 2-13-14 2-14 2-14 2-14 13-14 14 14 15 Gene F2rl1 Dsg2 Egfl7 Aif1 Ccl12 Mmp3 Apod Prkca Mdk Tnfaip8l2 Ctla2a Ifit3 Ereg Krt1 Il1f6 Penk Defb14 Gpx3 Log2FC −0.75 −0.95 0.68 0.76 0.83 0.80 0.63 −0.66 0.92 0.79 0.72 0.76 0.78 1.23 1.74 −0.59 1.33 0.82 Gene name coagulation factor II (thrombin) receptor-like 1 desmoglein 2 EGF-like domain 7 allograft inflammatory factor 1 chemokine (C-C motif) ligand 12 matrix metallopeptidase 3 apolipoprotein D protein kinase C, alpha Midkine tumor necrosis factor, α-induced protein 8-like 2 cytotoxic T lymphocyte-associated protein 2 α interferon-induced protein with tetratricopeptide repeats 3 Epiregulin keratin 1 interleukin 1 family, member 6 Preproenkephalin defensin beta 14 glutathione peroxidase 3 Table 1. DE genes associated with the most relevant biological processes enriched for the TME (mouse tissue) after melatonin treatment. Last column shows the biological processes associated with each gene, represented by numbers and detailed bellow. Biological process numbers are: (1) Cellular component movement (ID:GO:0006928); (2) Immune system process (ID:GO:0002376); (3) Regulation of cell motility (ID:GO:2000145); (4) Regulation of cell migration (ID:GO:0030334); (5) Cell migration (ID:GO:0016477); (6) Leukocyte migration (ID:GO:0050900); (7) Leukocyte chemotaxis (ID:GO:0030595); (8) Monocyte chemotaxis (ID:GO:0002548); (9) Cell chemotaxis (ID:GO:0060326); (10) Positive regulation of chemotaxis (ID:GO:0050921); (11) Negative regulation of chemokine production (ID:GO:0032682); (12) Regulation of inflammatory response (ID:GO:0050727); (13) Inflammatory response (ID:GO:0006954); (14) Defense response (ID:GO:0006952); (15) Response to reactive oxygen species (ID:GO:0000302). regulation of cell cycle arrest”, “Cell cycle checkpoint” (Supplementary Fig. S7) and the TGF-beta signaling path- way, which has a wide spectrum of cellular functions such as apoptosis, cell proliferation, differentiation, and migration. Genes from orangered module were related to immune system development, leukocyte differentia- tion, T cell differentiation, and the signaling pathways of Focal adhesion and Regulation of actin cytoskeleton (Supplementary Fig. S8). These data again suggest melatonin’s action is in regulating the immune system in the TME. Validation of genes modulated by melatonin treatment. Melatonin does not appear to have its principal activity at the gene level in tumor cells, as there was no DE gene in the melatonin-treated tumor cells. Co-expression and module preservation analyses have shown processes related to cell proliferation and tumor growth in melatonin treated-tumors, which are consistent with the reduced tumor growth, and most likely with an increase of apoptosis in melatonin-treated tumors. Thus, to validate these findings we evaluated the expres- sion of cleaved caspase-3 at protein levels in the tumor tissue by immunohistochemistry. In fact, results showed that cleaved caspase-3 expression was higher in melatonin-treated tumors, indicating the pro-apoptotic effect of melatonin (Fig. 5). For the TME, composed of murine cells, DE and co-expression analyses showed that melatonin influences several processes related to the immune system. Thus, we selected two DE genes affected by melatonin treat- ment to perform individual validation by real-time PCR. Interleukin 1 family, member 6 (Il1f6), also known as Interleukin-36α (IL-36α) and Tumor necrosis factor-a (TNF-a)-induced protein 8-like-2 (Tnfaip8l2) were selected to validate, as these genes are involved in the immune response and therefore may play an important role in the TME. Both genes were upregulated by melatonin treatment as evidenced by RNA-Seq results and its increase was confirmed by real-time PCR. Expression of Il1f6 and Tnfaip8l2 genes were significantly increased in melatonin-treated tumors when compared with control tumors (Fig. 6). Discussion Melatonin has a broad spectrum of actions ranging from the regulation of physiological functions, such as the circadian rhythm and redox state, to anti-cancer functions that control the development and growth of different types of tumors39,40. Its anti-proliferative and pro-apoptotic effects have been described in a variety of tumors in both in vitro and in vivo studies17,18,41. In this study, we showed that melatonin treatment reduced the tumor growth in a xenograft breast cancer model, and consistent with its reduction, melatonin was able to increase the protein expression of cleaved caspase-3, which is the main inducer of apoptosis. Similarly, in a DMBA-induced mammary carcinoma rat model, melatonin treatment increased apoptosis as observed by the upregulation of 5 Scientific RepoRts | (2019) 9:966 | https://doi.org/10.1038/s41598-018-37413-w
www.nature.com/scientificreports/ PathwayName Chemokine signaling pathway Phosphatidylinositol signaling system Glioma ErbB signaling pathway Pathways in cancer GnRH signaling pathway Leukocyte transendothelial migration Vascular smooth muscle contraction Tight junction Insulin signaling pathway Cell adhesion molecules (CAMs) Wnt signaling pathway Calcium signaling pathway Focal adhesion Genes Ccl12, Gng11, Gngt2 Prkca, Calm4 Prkca, Calm4 Prkca, Ereg Fzd1, Prkca, Col4a5 Prkca, Calm4 Prkca, Cldn5 Prkca,Calm4 Prkca, Cldn5 Ppp1r3b, Calm4 Nectin3, Cldn5 Fzd1, Prkca Prkca, Calm4 Prkca, Col4a5 Statistics C = 185; O = 3; E = 0.18; R = 17.06; rawP = 0.0007; adjP = 0.0042 C = 78; O = 2; E = 0.07; R = 26.97; rawP = 0.0025; adjP = 0.0058 C = 66; O = 2; E = 0.06; R = 31.88; rawP = 0.0018; adjP = 0.0058 C = 87; O = 2; E = 0.08; R = 24.18; rawP = 0.0032; adjP = 0.0067 C = 325; O = 3; E = 0.31; R = 9.71; rawP = 0.0037; adjP = 0.0071 C = 99; O = 2; E = 0.09; R = 21.25; rawP = 0.0041; adjP = 0.0072 C = 120; O = 2; E = 0.11; R = 17.53; rawP = 0.0059; adjP = 0.0087 C = 123; O = 2; E = 0.12; R = 17.11; rawP = 0.0062; adjP = 0.0087 C = 137; O = 2; E = 0.13; R = 15.36; rawP = 0.0076; adjP = 0.0094 C = 137; O = 2; E = 0.13; R = 15.36; rawP = 0.0076; adjP = 0.0094 C = 149; O = 2; E = 0.14; R = 14.12; rawP = 0.0089; adjP = 0.0104 C = 154; O = 2; E = 0.15; R = 13.66; rawP = 0.0095; adjP = 0.0105 C = 178; O = 2; E = 0.17; R = 11.82; rawP = 0.0126; adjP = 0.0132 C = 200; O = 2; E = 0.19; R = 10.52; rawP = 0.0157; adjP = 0.0157 Table 2. Pathways enriched for differently expressed (DE) genes in tumor microenvironment (TME) (mouse tissue) after melatonin treatment. C = the number of reference genes in the category; O = the number of genes in the gene set and also in the category; E = the expected number in the category; R: ratio of enrichment; rawP = p value from hypergeometric test; adjP = p value adjusted by the multiple test adjustment. tissue caspase-3 activity, TNF-alpha and the percentage of DNA fragmentation41,42. In addition, in a previous study, we showed that melatonin also acted as an anti-proliferative agent, reducing ki-67 protein expression and consequently the tumor growth11. In the current study, we reconfirmed melatonin reduces tumor growth and we performed a global analysis by RNA-Seq to identify the melatonin actions not only in tumor cells but also in the TME. It is known that melatonin is a pleiotropic anti-cancer molecule43. Recently, Reiter et al. described it as a ubiquitously-distributed molecule and suggested that its diverse actions could be mere epiphenomena of an underlying more fundamental melatonin action that remains to be discovered18. In our study, RNA-Seq analysis showed that melatonin treatment did not change gene expression directly in the tumor cells, but it modulates gene expression in the TME, which may have contributed in controlling the tumor growth. DE and co-expressed genes, as well as the gene modules that were influenced by melatonin treatment, showed functional enrichment mainly to processes associated with different aspects of immune response. It has been shown that immune cells express both membrane and nuclear melatonin receptors41,44. In addition, these cells have the enzymes to produce melatonin45, which can act as a paracrine, intracrine or an autocrine agent41,44,46. Thus, melatonin may influence immune responses in different levels47. Specifically, we showed that DE genes affected by melatonin treatment in the TME were mostly associated with cellular component movement and immune system processes. To note, this is the first study that evaluated the action of melatonin by RNA-Seq in a xenograft model. Few studies have used RNA-Seq to evaluate the action of melatonin in vitro. Through an RNA-Seq experiment, Mori et al.48 identified 14 upregulated genes following melatonin treatment in HCT116 colon cancer cells. Four of these 14 genes (p53, p38, PML, and H2AX) were described as miR-24–3p putative targets, an oncogenic microRNA. Melatonin decreased the miR-24 levels in HCT116 and MCF-7 cell lines, therefore reducing several pro-tumor processes associated with its target genes, such as cell proliferation, migration, DNA damage, cell transformation, and RNA metabolism, evidencing that miR-24 downregulation could be a major event among the anti-tumor actions of melatonin. Other studies using RNA-Seq experiments identified different mechanism of actions for melatonin, which involved inhibition of cell motility, invasion and migration in hepatocarcinoma49 and osteosarcoma cell lines50. In the breast cancer cell line MCF-7 treated with melatonin (1 nM and 100 nM for 72 hours), a transcriptomic analysis was performed using microarray gene expression profiling. Authors identified a large number of DE genes following melatonin treatments (1946 upregulated and 983 downregulated). As expected, those genes were mainly involved in cell proliferation, adhesion, apoptosis, cell cycle, as well as immune response51. In this study, in addition to the differential expression analysis to identify DE genes, we performed differential connectivity and module preservation analyses. These results were complementary to the DE genes and con- firmed the action of melatonin mainly on the immune system. First, the differential connectivity analysis showed that connected genes in the tumor cells from the control group were associated with signaling pathways that indicate an immune response in a xenograft model, such as allograft rejection, acute graft-versus-host disease, and antigen processing and presentation. These results may indicate the processes that are occurring in the tumor cells to establish and develop a tumor in the murine host environment. Although we used a T-cell deficient mouse model (athymic Foxn1nu) that has limitations to studying the response to therapy52, it is important to note that these mice show an intact humoral adaptive immune system as well as an intact innate immune system53, which could, to some extent, lead to an immune response. On the other hand, connected genes in the TME from the control group were associated with pos- itive regulation of cellular processes consistent with cell proliferation and tumor growth. Interestingly in the melatonin-treated TME, connected genes were associated with negative regulation of those processes, suggesting that melatonin treatment is inhibiting pro-tumor cellular processes. In the module preservation analyses, 3 gene 6 Scientific RepoRts | (2019) 9:966 | https://doi.org/10.1038/s41598-018-37413-w
www.nature.com/scientificreports/ Figure 4. Weighted gene coexpression network analysis (WGCNA) identified modules of co-expressed genes. Values of Zsummary above 10 represent modules of genes highly preserved. Values between 2 and 10 represent poor to moderate preservation, which can indicate sets of genes influenced by melatonin treatment. (A) Three modules of genes with moderated preservation (pink, magenta and black) were identified to MDA-MB-231 human breast cancer cells; (B) Three modules of genes with moderated preservation (darkolivegreen, yellowgreen and orangered) were identified to the tumor microenvironment (murine cells). modules were identified as being strongly influenced by melatonin treatment in the TME, which were associated with cellular processes involved in cell proliferation and again in the regulation of immune system, evidencing once again the key role of melatonin in the immune response in the TME. According to our results, melatonin’s effects on the immune system have been described in several studies. Melatonin showed immunoenhancing properties54, and its exogenous administration enhanced both innate and cellular immunity41, being able to regulate inflammatory cytokines and mediators, expression of transcription factors genes47, and the haemopoiesis55. Melatonin administration also enhanced the production of progenitor cells for granulocytes-macrophages, natural killer cells, monocytes, and leukocytes41, as well as the production of cytokines including interleukins (IL-2, IL-6, IL-12), interferon-gamma and TNF-alpha54,56. Although many stud- ies have implicated melatonin as a positive regulator of the immune system, others have described melatonin as an anti-inflammatory45. In the early phases of inflammation, melatonin can activate pro-inflammatory mediators, such as IL-1 and TNF-alpha, while in the chronic phase, it contributes to the inflammation attenuation by down- regulating cytokines, inducing the survival pathway in leukocytes and blocking oxidative stress by its antioxidant properties41,45,47,57. In our results, melatonin treatment was also able to upregulate the glutathione peroxidase 3 (Gpx3) in the TME, an important antioxidant enzyme. In this context, the effects of melatonin on the immune system were observed in our study, which may mod- ulate the inflammatory response by different mechanisms. Specifically, we validated melatonin action on two genes involved in the immune response and tumor progression. Il1f6 shows an important pro-inflammatory role in chronic immune disorders58,59 and recently its role in cancer has been described59,60. This gene is a member of the IL-1 family of cytokines, also composed of two other agonists, IL-36-β (IL-1F8) and IL-36γ (IL-1F9) and one antagonist IL-36Ra (IL-1F5)61,62. The IL-36 family of cytokines supports the generation of pro-inflammatory immune responses and its possible functions in cancer still under investigation62. In 2014, Wang et al. reported that low expression of IL-36α was correlated with larger tumor size and poor prognosis of colorectal cancer patients63. Recent studies have demonstrated the use of IL-36 as an immunotherapeutic agent in cancer therapy. Chang et al. showed that IL-36 gene therapy can inhibit the growth in xenograft model of epithelial ovarian cancer59. Moreover, its upregulation was able to regress the tumor masses in fibrosarcoma mouse model and reduce the Ki-67 expression60. IL-36γ exerted profound antitumor effects in a melanoma mice model, transforming the TME in favor of tumor eradication62. An interesting review by Weinstein and Storkus describes IL-36 as an orchestra- tor of Tertiary Lymphoid Structures (TLS), an ectopic lymphoid formation, in the TME. They suggest that IL-36 production in the TME has potential protective and therapeutic roles in a cancer-bearing host, by acting in both humoral and cellular immunity64. 7 Scientific RepoRts | (2019) 9:966 | https://doi.org/10.1038/s41598-018-37413-w
www.nature.com/scientificreports/ Figure 5. Immunohistochemistry staining with Cleaved Caspase-3 in breast cancer cells. (A) Representative image of control and (B) melatonin-treated tumors. Images were taken with 40X magnification. Scale bar = 0.2 cm. (C) A significant increase was observed in melatonin-treated tumors compared with control tumors (**p = 0.0078). Image analysis was performed by optical density to quantify the relative intensity of immunoreactivity. Values were obtained as arbitrary units (a.u.) and the mean optical density values were compared between groups using Student’s t-test. Figure 6. Gene expression analysis by Real time PCR in the tumor microenvironment (TME). (A)Relative quantification of Il1f6 gene expression; (B) Relative quantification of Tnfaip8l2 gene expression. Genes were normalized to gapdh expression. Values are expressed as mean ± standard deviation (SD) of experiments performed in triplicate. *p < 0.05 melatonin-treated tumor vs. control tumors by Student t-test. Another gene involved in the immune system and upregulated by melatonin in the TME was the Tnfaip8l2, which is a member of the tumor necrosis TNFAIP8 family and an essential negative regulator of both innate and adaptive immunity, showing high expression in immune cells65. Despite its role in maintaining immune homeosta- sis, Tnfaip8l2 is also involved in the development and progression of several tumors66,67. Its expression is reduced or absent in some cancers, such as gastric cancer, lung cancer, hepatocellular carcinoma66,68, and breast cancer65. Recently, Wang et al. showed that the overexpression of Tnfaip8l2 inhibited the tumor growth in a xenograft MDA-MB-231 breast cancer model. In addition, Tnfaip8l2 prevented the EMT phenotype, by inhibiting the expres- sion of β-catenin, cyclin D1 and c-Myc in MDA-MB-231 and MCF-7 breast cancer cells69. Similar results were also reported in a xenograft model of gastric cancer. Adenovirus-mediated Tnfaip8l2 overexpression suppressed the tumor growth by increasing apoptosis and reduced cell migration, invasion and metastasis via reversal of EMT70. Zhang et al., using a syngeneic model of breast cancer (Balb/c mice implanted with 4T1 cells) showed that the overexpression of Tnfaip8l2 inhibited the proliferation of 4T1 cells in vitro and in vivo. Interestingly, the treatment 8 Scientific RepoRts | (2019) 9:966 | https://doi.org/10.1038/s41598-018-37413-w
www.nature.com/scientificreports/ with Tnfaip8l2 gene delivery in vivo promoted CD8 + T and NK cell-mediated anti-tumor immune responses in the TME. In addition, Tnfaip8l2 inhibited the expansion and recruitment of myeloid-derived suppressor cells (MDSCs), which exert immune-suppressive effects and promote tumor progression71. Previously, they showed that the overexpression of Tnfaip8l2 in MDA-MB-231 cells leads to a reduction of proliferation, migration, and invasion in vitro and inhibits the tumorigenesis of breast cancer in vivo65. Taken together, studies indicate the importance of Tnfaip8l2, as well as the Il1f6, on the immune response. Thus, the capacity of melatonin to increase these genes in the TME suggests additional actions of melatonin that contribute to the control of tumor growth. In conclusion, our study has shown that melatonin acts by regulating gene expression mainly in the TME and sug- gest new actions to its molecule on modulation of immune response and tumor growth control in an MDA-MB-231 breast cancer xenograft mouse model. It is important to mention the limitations of this study, which analyzed the melatonin actions only in one pre-clinical tumor model, therefore limiting our conclusions to this specific type of cancer. However, our results from the transcriptomic analysis open possibilities to focus on specific targets in triple negative breast cancer patients, in order to understand the effects of melatonin in this type of tumor, that lacks specific therapeutic targets. Moreover, the current results merit further investigations in other tumor types, and more impor- tantly, show an important action of melatonin in the TME, which is a field worth exploring in future investigations. Methods Breast cancer xenograft model. All procedures were approved by the Ethics Committee on the Use of Animals of Faculdade de Medicina de São José do Rio Preto (001-003336/2014) and developed following national and international standards of ethics in animal experimentation. Human triple-negative breast cancer cell line MDA-MB-231 (American Type Culture Collection, Manassas, Virginia, USA) was cultured in RPMI-1640 (Life Technologies, Carlsbad, California, US) with 10% of fetal bovine serum (FBS) (Life Technologies, Carlsbad, California, US) and 1% of penicillin/streptomycin (Life Technologies, Carlsbad, California, US) at 37 °C and 5% CO2. Cells were detached using trypsin, suspended in the growth medium, washed with phosphate-buffered saline (PBS) twice and re-suspended at the 3 × 10⁶ cells to be inocu- lated in the right 4 th mammary gland of Balb/c athymic nude mice (n = 10). Mice were randomly divided in control and melatonin-treated groups. The treatment was performed in accordance with a previous study11. Mice received melatonin (Sigma, St. Louise, MO, USA) (100 µl at the dose of 40 mg/kg of body weight) by intraperitoneal injection (IP) 5 days a week, while control mice received IP injection with 100 µl of vehicle solution (8 phosphate buffered saline (PBS): 1 dimethyl sulfoxide (DMSO): 1 Cremophor (Sigma, St. Louise, MO, USA). Treatments were given 1 hour before room lighting was switched off. Mouse weight was periodically monitored during the experiment. Tumors were measured by digital caliper and tumor volume was calculated as 1/2 (length × width2). samples collection and RNA extraction. Mice were euthanized using ketamine and xylazine, tumors were collected and immediately frozen in liquid nitrogen. Total RNA was extracted using TRIZOL reagent (Invitrogen Life Technologies®, Sao Paulo, SP, BR). Tumors were homogenized using 1 ml of TRIZOL per 50 mg of tissue. 200 µl of chloroform were added per 1 mL of Trizol for each sample. Samples were incubated for 3 minutes in room tem- perature and centrifugated for 15 minutes at 12000 × g at 4 °C. The aqueous phase containing the RNA was trans- ferred to a new tube and 500 µl of isopropanol was added. Solution was incubated for 10 minutes and centrifuged for 10 minutes at 12,000 × g at 4 °C. Following, the supernatant was discarded and the pellet containing the RNA was resuspend in 1 mL of 75% ethanol. Solution was centrifuged for 5 minutes at 7500 × g at 4 °C and the supernatant was discarded. The RNA pellet was left to dry for 10 minutes and resuspend in 20 µL of RNase-free water. RNA quality and quantity were assessed using automated capillary gel electrophoresis on Bioanalyzer 2100 with RNA 6000 Nano Labchips (Agilent Technologies Ireland, Dublin, Ireland). First, the reagents were left to equilibrate in room temperature for 30 minutes. Then, 1 μl of RNA 6000 Nano dye concentrate was added to 65 μl of Agilent RNA 6000 Nano gel matrix. This solution was vortexed thoroughly to proper mixing of gel and dye and centrifuged for 10 minutes at room temperature at 13000 g. Gel-Dye was loaded into a new RNA chip and then 1 µl of RNA 6000 Nano Marker and 1 µl of each sample were added into the wells. The chip was vortexed for 1 minute at 2400 rpm and inserted in the Agilent 2100 Bioanalyzer to run the analysis. All samples presented RNA integrity number (RIN) higher than 8.0 (Supplementary Fig. S9). preparation and sequencing of Illumina RNA libraries. RNA-Seq libraries were created using Truseq RNA-Seq Library Prep Kit-v2. The experiment was paired-end with 100nt read length, performed on the Illumina HiSeq. 2500 sequencer. In summary, 1 μg of total RNA was used to isolate mRNA poli(A) by two rounds of purification using oligo dT magnetic beads followed by fragmentation and cDNA synthesis by random hexamer primers and reverse transcriptase. Next, end repair and 3′ ends adenylation of the fragments was performed by adding a nucleotide A (A-Tailing Mix) to the 3′ end in order to prevent them to binding to each other during the ligation of adapt- ers. Bar-coded adapters were ligated to the cDNA fragments and a PCR reaction was performed to produce the sequencing libraries. The quality of libraries and quantification were performed using Agilent 2100 Bioanalyzer and qPCR with KAPA Library Quantification kit (KAPA Biosystems, Foster City, USA). Adapter-ligated cDNA fragment libraries were run on Illumina HiSeq. 2500 equipment using TruSeq PE Cluster Kit and TruSeq SBS Kit (2 × 100 bp). All 10 samples were sequenced in one lane, producing about 30 million reads per library. Reads alignment and differential expression analysis. Sequencing quality was evaluated by FastQC software (http://www.bioinformatics.babraham.ac.uk/projects/fastqc/). Adaptors and poor quality bases were trimmed by Trimmomatic software72 and only reads with at least 50 bp in length were kept for further analyses. 9 Scientific RepoRts | (2019) 9:966 | https://doi.org/10.1038/s41598-018-37413-w
www.nature.com/scientificreports/ An alignment strategy was used to especially analyze data of xenograft samples, which contain two genomes. Therefore, to differentiate human and mouse expression we used a strategy similar to the species-specific RNA-Seq workflow used by Bradford et al.33. Common reads between the two genomes (those aligning with equal similarity in human and in mouse) were discarded. Although some information may be lost by discarding the “common reads”, it is an important step to avoid false positive. To differentiate human and mouse expression, the alignment was performed to filter out mouse-like reads before mapping to the human reference and vice versa, and data were mapped against human (GRCh37/hg19) and mouse (NCBI37/mm9) genomes separately, using the STAR software. The HTSeq was employed for read counts and DESeq. 2 was used to identify DE genes between melatonin treated and control tumors for each spe- cies. DE genes were obtained for each organism: human characterizing the MDA-MB-231 tumor cells and mouse characterizing the TME. Genes with adjusted p-value (adjP) ≤ 0.1 and fold change (FC) values ≤−1.5 and ≥1.5 were considered as DE genes and down-regulated or up-regulated in the melatonin-treated group, respectively. Differential connectivity analysis. As a quality control, genes with zero expression values in more than half (5) of the samples and genes with average read counts less than 10 and standard deviation less than 5 were excluded. Genes with low counts may represent a bias of sequencing and genes with little variation contribute less to the network analysis. A total of 13669 human genes and 13899 mouse genes remained. Data were then divided into 2 sub-networks, one composed of melatonin-treated mice and the other composed of control mice. The sub-networks were created using WGCNA package in R environment73, and the total connectivity value of each gene within the network was calculated. Connectivity is the sum of the correlations between the expression of a given gene and the expression of each of the other genes in the network. Connectivity values of each gene in the two sub-networks were divided by the maximum connectivity found in each sub-network, so that the two sub-networks could have comparable values. The connectivity value of each gene from the control group was then subtracted from the connectivity value of the same gene in the melatonin-treated group. The resulting values ranged from 1 to −1 and genes with values greater than |0.6| were considered differentially connected. Negative values are associated with highly connected genes in the control group and poorly connected in the melatonin-treated group, while positive differential connectivity values are associated with highly connected genes in the melatonin-treated group and poorly connected in the control group. A change in gene behavior, from highly connected to lowly connected and vice-versa can indicate a response to melatonin treatment. Module preservation analysis. The same 13669 human genes and 13899 mouse genes which passed quality control were used to create a smaller set of genes, by selecting the 3000 most connected genes in each of the groups (melatonin vs control), which resulted in a total of 4557 human genes and 5383 mouse genes. A gene co-expression analysis was then performed using WGCNA package in R environment and modules of co-expressed genes were identified for the control group. Different color names were assigned to each module. Those modules were compared with the expression data of the melatonin-treated group for the evaluation of module preservation between the two groups. The preservation measurement is given by Zsummary were: mod- ules with values greater than 10 are highly preserved; modules with values between 2 and 10 have poor to moder- ate preservation and modules with values below 2 are not preserved. Modules that are not preserved can indicate sets of genes influenced by melatonin treatment. Functional enrichment analysis. Functional enrichment of GO terms and KEEG analyses were per- formed using the WEB-based GEne SeT AnaLysis Toolkit (Webgestalt). Human and murine data were tested separately. For the DE gene lists, the specific genome for each organism was used as background, while a list of all genes that passed the quality control was used as background to each organism for the differentially connected genes and gene modules. P-values for each term were obtained through hypergeometric analysis and corrected for FDR by Benjamini–Hochberg method. Terms were considered significant when adjP ≤ 0.1. Real time pCR. Quantitative real-time PCR was used to validate the selected DE genes by melatonin treat- ment in the TME. Total RNA (100 ng) was used to generate cDNA by using the High-Capacity cDNA Reverse Transcription (Applied Biosystems). Each reaction included 20 ul of 2X RT master mix, containing 10X RT Buffer, 25X dNTP mix, 10X RT random primers, MultiScribe Reverse Transcriptase, nuclease-free water and 100 ng of RNA samples. Samples were incubated for 10 minutes at 25 °C, 120 minutes at 37 °C, 5 minutes at 85 °C and then stored at 4 °C. Gene expression of tnfaip8l2 and il1f6 was detected by real-time PCR (Step One Plus (Applied Biosystems) using SYBR Green master mix (Life Technology). Gapdh was used as the inter- nal control. Primers sequences used were: Tnfaip8l2 5′-CTGGCTCTGGCTACACGATT-3′ (forward) and 5′-ACCTCACCGAAGCTAAGTGC-3′ (reverse); Il1f6 5′-CTCTTGAGACGAACAGGGGG-3′(forward) and 5′-ATGTTCCCTTCCCCAAGCTG-3′ (reverse); Gapdh 5′-GGTGAAGGTCGGTGTGAACG-3′(forward) and 5′-CTCGCTCCTGGAAGATGGTG-3′(reverse). Assays were run in 20 ul volume with final primer concentration of 200 nm for both reverse and forward primers. The conditions used were 2 minutes at 50 °C, 2 minutes at 95 °C, 40 cycles of 15 seconds at 95 °C followed by 15 seconds at 58 °C and 1 minute at 72 °C. Finally, a dissociation curve stage for 15 seconds at 95°, 15 seconds at 58 °C and 15 seconds at 95 °C. The relative expression of each gene was calculated using the 2−ΔΔCt. Experiments were performed in triplicate. Immunohistochemistry. Paraffin-embedded tissue sections of 3 µm were obtained, deparaffinized and rehydrated. Sections were incubated with Hydrogen Peroxide Block (Spring Bioscience, Pleasanton, CA, USA) for 10 minutes, washed in PBS 1×, incubated with Protein Block solution (Spring Bioscience, Pleasanton, CA, USA) for 10 minutes and washed again. Then, antigen retrieval was done at 95 °C with Citrate buffer (pH 6.0) for 30 minutes. Sections were incubated with anti-cleaved Caspase-3 antibody (Ab4051 - Abcam, Cambridge, MA, 10 Scientific RepoRts | (2019) 9:966 | https://doi.org/10.1038/s41598-018-37413-w
www.nature.com/scientificreports/ USA) at 4 °C overnight and then with horseradish peroxidase (HRP) conjugate, containing the goat anti-rabbit antibody conjugated to HRP, for 15 minutes at room temperature. Sections were washed and incubated with 3,3′-diaminobenzidine tetrahydrochloride (DAB) (Spring Bioscience, Pleasanton, CA, USA) for 3 minutes and then counterstained with Harris’s hematoxylin. Finally, sections were dehydrate and coverslipped with Permount mounting medium (Fisher Scientific,Hampton, New Hampshire, USA). Negative control was obtained by omit- ting the primary antibody, and tonsil was used as internal positive control of the assay. Cleaved caspase-3 immunostaining was analyzed based on the intensity of the staining by optical density using ImageJ software (NIH, Bethesda MD, USA). Multiple fields from each histological slide were examined using the Nikon Eclipse E 200 microscope (Nikon Instruments, Melville, NY, USA). Then, three areas were pho- tographed at 40X and 20 spots (small circular regions of interest) were randomly selected in each photographed area. Thus, the intensity was determined from a total of 60 spots of each sample to average the relative intensity of immunoreactivity. The values were obtained as arbitrary units (a.u.), and the mean optical density (M.O.D.) indicated the specific staining intensity in the immunoreactive areas. statistical analyses. To analyze the real time PCR and immunohistochemistry data, the results were pre- viously submitted to descriptive analysis to determine the normality. The mean values for each group (melatonin versus control) were compared by Student’s t-test. Analyses were performed using the GraphPad Prism6 software (Graph-Pad Software, La Jolla, CA, USA) and p-values less than 0.05 were considered statistically significant. Data Availability All data generated or analyzed during this study are included in this published article and its Supplementary Information files. References 1. DeSantis, C. E., Ma, J., Goding Sauer, A., Newman, L. A. & Jemal, A. Breast cancer statistics, 2017, racial disparity in mortality by state. CA. Cancer J. Clin, https://doi.org/10.3322/caac.21412 (2017). 2. Fallahpour, S., Navaneelan, T., De, P. & Borgo, A. Breast cancer survival by molecular subtype: a population-based analysis of cancer registry data. C. Open5, E734–E739 (2017). 3. Apuri, S. Neoadjuvant and Adjuvant Therapies for Breast Cancer. South. Med. J.110, 638–642 (2017). 4. Adams, T. A. et al. Composite analysis of immunological and metabolic markers defines novel subtypes of triple negative breast cancer. Mod. Pathol., https://doi.org/10.1038/modpathol.2017.126 (2017). 5. Maganhin, C. C. et al. [Melatonin effects on the female genital system: a brief review]. Rev. Assoc. Med. Bras.54, 267–271 (2008). 6. Zhu, C., Huang, Q. & Zhu, H. Melatonin Inhibits the Proliferation of Gastric Cancer Cells Through Regulating the miR-16-5p- Smad3 Pathway. DNA Cell Biol., https://doi.org/10.1089/dna.2017.4040 (2018). 7. Orendáš, P. et al. Melatonin potentiates the anti-tumour effect of pravastatin in rat mammary gland carcinoma model. Int. J. Exp. Pathol, https://doi.org/10.1111/iep.12094 (2014). 8. González, A. et al. Melatonin inhibits angiogenesis in SH-SY5Y human neuroblastoma cells by downregulation of VEGF. Oncol. Rep. https://doi.org/10.3892/or.2017.5446 (2017). 9. Zonta, Y. R. et al. Melatonin reduces angiogenesis in serous papillary ovarian carcinoma of ethanol-preferring rats. Int. J. Mol. Sci., https://doi.org/10.3390/ijms18040763 (2017). 10. Maschio-Signorini, L. B. et al. Melatonin regulates angiogenic and inflammatory proteins in MDA-MB-231 cell line and in co- culture with cancer-associated fibroblasts. Mini-Reviews Med. Chem.16, 1474–1484 (2016). 11. Jardim-Perassi, B. V. et al. Effect of melatonin on tumor growth and angiogenesis in xenograft model of breast cancer. PLoS One9, e85311 (2014). 12. Akbarzadeh, M. et al. The potential therapeutic effect of melatonin on human ovarian cancer by inhibition of invasion and migration of cancer stem cells. Sci. Rep. https://doi.org/10.1038/s41598-017-16940-y (2017). 13. Borin, T. F. et al. Melatonin decreases breast cancer metastasis by modulating Rho-associated kinase protein-1 expression. J. Pineal Res.60, 3–15 (2016). 14. Kim, T. H. & Cho, S. G. Melatonin-induced KiSS1 expression inhibits triple-negative breast cancer cell invasiveness. Oncol. Lett., https://doi.org/10.3892/ol.2017.6434 (2017). 15. Sainz, R. M. et al. Melatonin reduces prostate cancer cell growth leading to neuroendocrine differentiation via a receptor and PKA independent mechanism. Prostate, https://doi.org/10.1002/pros.20155 (2005). 16. González, A. et al. In vivo inhibition of the estrogen sulfatase enzyme and growth of DMBA-induced mammary tumors by melatonin. Curr. Cancer Drug Targets, https://doi.org/10.2174/156800910791190201 (2010). 17. Hill, S. M. et al. Melatonin: An inhibitor of breast cancer. Endocrine-Related Cancer22, R183–R204 (2015). 18. Reiter, R. J. et al. Melatonin, a full service anti-cancer agent: Inhibition of initiation, progression and metastasis. International Journal of Molecular Sciences18 (2017). 19. Jardim-Perassi, B. V. et al. Melatonin regulates angiogenic factors under hypoxia in breast cancer cell lines. Anticancer. Agents Med. Chem., https://doi.org/10.2174/1871520615666150511094201 (2016). 20. Dai, M. et al. Melatonin modulates the expression of VEGF and HIF-1α induced by CoCl2in cultured cancer cells. J. Pineal Res., https://doi.org/10.1111/j.1600-079X.2007.00498.x (2008). 21. Carbajo-Pescador, S. et al. Inhibition of VEGF expression through blockade of Hif1α and STAT3 signalling mediates the anti- angiogenic effect of melatonin in HepG2 liver cancer cells. Br. J. Cancer, https://doi.org/10.1038/bjc.2013.285 (2013). 22. Park, S.-Y. et al. Melatonin suppresses tumor angiogenesis by inhibiting HIF-1alpha stabilization under hypoxia. J. Pineal Res.48, 178–84 (2010). 23. Dubocovich, M. L. & Markowska, M. Functional MT1 and MT2 melatonin receptors in mammals. Endocrine27, 101–110 (2005). 24. Sánchez-Barceló, E. J., Cos, S., Fernández, R. & Mediavilla, M. D. Melatonin and mammary cancer: A short review. in. Endocrine- Related Cancer10, 153–159 (2003). 25. Reiter, R. J. et al. Melatonin: detoxification of oxygen and nitrogen-based toxic reactants. Adv. Exp. Med. Biol.527, 539–48 (2003). 26. Suwanjang, W., Abramov, A. Y., Charngkaew, K., Govitrapong, P. & Chetsawang, B. Melatonin prevents cytosolic calcium overload, mitochondrial damage and cell death due to toxically high doses of dexamethasone-induced oxidative stress in human neuroblastoma SH-SY5Y cells. Neurochem. Int., https://doi.org/10.1016/j.neuint.2016.05.003 (2016). 27. Tahan, G. et al. Melatonin expresses powerful anti-inflammatory and antioxidant activities resulting in complete improvement of acetic-acid-induced colitis in rats. Dig. Dis. Sci.56, 715–720 (2011). 28. Janjetovic, Z. et al. Melatonin and its metabolites protect human melanocytes against UVB-induced damage: Involvement of NRF2- mediated pathways. Sci. Rep., https://doi.org/10.1038/s41598-017-01305-2 (2017). 29. Galdiero, M. R. et al. Tumor associated macrophages and neutrophils in cancer. Immunobiology218, 1402–1410 (2013). 11 Scientific RepoRts | (2019) 9:966 | https://doi.org/10.1038/s41598-018-37413-w
www.nature.com/scientificreports/ 30. Ribatti, D. Mast cells and macrophages exert beneficial and detrimental effects on tumor progression and angiogenesis. Immunology Letters152, 83–88 (2013). 31. Gajewski, T. F., Schreiber, H. & Fu, Y.-X. Innate and adaptive immune cells in the tumor microenvironment. Nat. Immunol.14, 1014–1022 (2013). 32. Cohen, I. J. & Blasberg, R. Impact of the Tumor Microenvironment on Tumor-Infiltrating Lymphocytes: Focus on Breast Cancer. Breast Cancer (Auckl).11, 1178223417731565 (2017). 33. Bradford, J. R. et al. RNA-Seq Differentiates Tumour and Host mRNA Expression Changes Induced by Treatment of Human Tumour Xenografts with the VEGFR Tyrosine Kinase Inhibitor Cediranib. PLoS One8 (2013). 34. Stakleff, K. D. S. & Von Gruenigen, V. E. Rodent models for ovarian cancer research. Int. J. Gynecol. Cancer13, 405–12 (2003). 35. Szadvari, I., Krizanova, O. & Babula, P. Athymic Nude Mice as an Experimental Model for Cancer Treatment Cancer diseases and their treatment. Physiol. Res65, 441–453 (2016). 36. Conesa, A. et al. A survey of best practices for RNA-seq data analysis. Genome Biol.17, 13 (2016). 37. Alexandre, P. A. et al. Liver transcriptomic networks reveal main biological processes associated with feed efficiency in beef cattle. BMC Genomics16, 1073 (2015). 38. Liu, R., Cheng, Y., Yu, J., Lv, Q.-L. & Zhou, H.-H. Identification and validation of gene module associated with lung cancer through coexpression network analysis. Gene563, 56–62 (2015). 39. Chen, L., Liu, L., Li, Y. & Gao, J. Melatonin increases human cervical cancer HeLa cells apoptosis induced by cisplatin via inhibition of JNK/Parkin/mitophagy axis. In Vitro Cellular and Developmental Biology - Animal 1–10, https://doi.org/10.1007/s11626-017- 0200-z (2017). 40. Sardo, F. L, Muti, P., Blandino, G. & Strano, S. Melatonin and hippo pathway: Is there existing cross-talk? Int. J. Mol. Sci. 18 (2017). 41. Sánchez-Hidalgo, M., Guerrero, J. M., Villegas, I., Packham, G. & De La Lastra, C. A. Melatonin, a natural programmed cell death inducer in cancer. Curr. Med. Chem.19, 3805–21 (2012). 42. El-Aziz, M. A. A. et al. The biochemical and morphological alterations following administration of melatonin, retinoic acid and Nigella sativa in mammary carcinoma: an animal model. Int. J. Exp. Pathol.86, 383–396 (2005). 43. Asghari, M. H., Moloudizargari, M., Ghobadi, E., Fallah, M. & Abdollahi, M. Melatonin as a multifunctional anti-cancer molecule: Implications in gastric cancer. Life Sciences185, 38–45 (2017). 44. Carrillo-Vico, A., Guerrero, J. M., Lardone, P. J. & Reiter, R. J. A Review of the Multiple Actions of Melatonin on the Immune System. Endocrine27, 189–200 (2005). 45. Carpentieri, A. Diaz De Barboza, G., Areco, V., Peralta Lopez, M. & Tolosa De Talamoni, N. New perspectives in melatonin uses. Pharmacological Research65, 437–444 (2012). 46. Kim, T. K. et al. Metabolism of melatonin and biological activity of intermediates of melatoninergic pathway in human skin cells. FASEB J.27, 2742–2755 (2013). 47. Najafi, M. et al. Melatonin as an anti-inflammatory agent in radiotherapy. Inflammopharmacology25, 403–413 (2017). 48. Mori, F. et al. Multitargeting activity of miR-24 inhibits long-term melatonin anticancer effects. Oncotarget7, 20532–20548 (2016). 49. Wang, T. H. et al. Melatonin inhibits the progression of hepatocellular carcinoma through microRNA let7i-3p mediated RAF1 reduction. Int. J. Mol. Sci., https://doi.org/10.3390/ijms19092687 (2018). 50. Lu, K. H. et al. Melatonin attenuates osteosarcoma cell invasion by suppression of C-C motif chemokine ligand 24 through inhibition of the c-Jun N-terminal kinase pathway. J. Pineal Res., https://doi.org/10.1111/jpi.12507 (2018). 51. Lee, S. E. et al. Molecular analysis of melatonin-induced changes in breast cancer cells: Microarray study of anti-cancer effect of melatonin. Biochip J., https://doi.org/10.1007/s13206-011-5409-4 (2011). 52. Céspedes, M. V., Casanova, I., Parreño, M. & Mangues, R. Mouse models in oncogenesis and cancer therapy. Clin. Transl. Oncol.8, 318–329 (2006). 53. Shultz, L. D. et al. Human cancer growth and therapy in immunodeficient mouse models. Cold Spring Harb. Protoc.2014, 694–708 (2014). 54. Srinivasan, V., Pandi-Perumal, S. R., Brzezinski, A., Bhatnagar, K. P. & Cardinali, D. P. Melatonin, Immune Function and Cancer. Recent Pat. Endocr. Metab. Immune Drug Discov.5, 109–23 (2011). 55. Vinther, A. G. & Claësson, M. H. The influence of melatonin on the immune system and cancer. Ugeskr. Laeger177, 20–23 (2015). 56. Maestroni, G. J. The immunotherapeutic potential of melatonin. Expert Opin. Investig. Drugs10, 467–476 (2001). 57. Radogna, F., Diederich, M. & Ghibelli, L. Melatonin: A pleiotropic molecule regulating inflammation. Biochemical Pharmacology80, 1844–1852 (2010). 58. Blumberg, H. et al. Opposing activities of two novel members of the IL-1 ligand family regulate skin inflammation. J. Exp. Med.204, 2603–2614 (2007). 59. Chang, L., Guo, R. & Yuan, Z. IL-36α suppresses proliferation of ovarian cancer cells. Tumor Biol.39, 101042831770691 (2017). 60. Solahaye-Kahnamouii, S. et al. The effect of interleukin 36 gene therapy in the regression of tumor. Iran. J. Cancer Prev.7, 197–203 (2014). 61. Gresnigt, M. S. & Van de Veerdonk, F. L. Biology of IL-36 cytokines and their role in disease. Seminars in Immunology25, 458–465 (2013). 62. Wang, X. et al. IL-36γ Transforms the Tumor Microenvironment and Promotes Type 1 Lymphocyte-Mediated Antitumor Immune Responses. Cancer Cell28, 296–306 (2015). 63. Wang, Z.-S. et al. Decreased expression of interleukin-36α predicts poor prognosis in colorectal cancer patients. Int. J. Clin. Exp. Pathol.7, 8077–81 (2014). 64. Weinstein, A. M. & Storkus, W. J. Therapeutic Lymphoid Organogenesis in the Tumor Microenvironment. Adv. Cancer Res.128, 197–233 (2015). 65. Zhang, Z. et al. TIPE2 suppresses the tumorigenesis, growth and metastasis of breast cancer via inhibition of the AKT and p38 signaling pathways. Oncol. Rep. 36, 3311–3316 (2016). 66. Gus-Brautbar, Y. et al. The Anti-inflammatory TIPE2 Is an Inhibitor of the Oncogenic Ras. Mol. Cell45, 610–618 (2012). 67. Lou, Y. et al. Enhanced atherosclerosis in TIPE2-deficient mice is associated with increased macrophage responses to oxidized low- density lipoprotein. J. Immunol.191, 4849–57 (2013). 68. WU, J. et al. TIPE2 functions as a metastasis suppressor via negatively regulating β-catenin through activating GSK3β in gastric cancer. Int. J. Oncol.48, 199–206 (2016). 69. Wang, K., Ren, Y., Liu, Y., Zhang, J. & He, J.-J. Tumor necrosis factor (TNF)-α-induced protein 8-like-2 (TIPE2) inhibits proliferation and tumorigenesis in breast cancer cells. Oncol. Res.25, 55–63 (2017). 70. Yin, H. et al. Adenovirus-mediated TIPE2 overexpression inhibits gastric cancer metastasis via reversal of epithelial-mesenchymal transition. Cancer Gene Ther.24, 180–188 (2017). 71. Zhang, Z., Liu, L., Cao, S., Zhu, Y. & Mei, Q. Gene delivery of TIPE2 inhibits breast cancer development and metastasis via CD8+ T and NK cell-mediated antitumor responses. Mol. Immunol.85, 230–237 (2017). 72. Bolger, A. M., Lohse, M. & Usadel, B. Trimmomatic: A flexible trimmer for Illumina sequence data. Bioinformatics30, 2114–2120 (2014). 73. Langfelder, P. & Horvath, S. WGCNA: an R package for weighted correlation network analysis. BMC Bioinformatics9, 559 (2008). 12 Scientific RepoRts | (2019) 9:966 | https://doi.org/10.1038/s41598-018-37413-w
www.nature.com/scientificreports/ Acknowledgements We thank Fundação de Amparo à Pesquisa do Estado de São Paulo for the financial support (2014/13815-5), as well as Fundaçao de Apoio a Pesquisa e Extensao de Sao Jose do Rio Preto (FAPERP). The funders had no role in study design, data collection and analysis, decision to publish, or preparation of the manuscript. Author Contributions B.V.J.P. conducted the study, contributing with concept/design, acquisition of data, data analysis/interpretation and drafting of the manuscript. P.A.A. contributed with data analysis/interpretation and drafting of the manuscript. N.M.S. and R.P.J. contributed with concept/design and acquisition of data. R.C. contributed with concept/design, data interpretation and critical revision of the manuscript. L.L.C. contributed with acquisition of data and analysis. O.R.J. contributed with data analysis/interpretation and drafting of the manuscript. H.F. contributed to data analysis/interpretation and critical revision of the manuscript. D.A.P.C.Z. contributed with concept/design, data interpretation and critical revision of the manuscript. Additional Information Supplementary information accompanies this paper at https://doi.org/10.1038/s41598-018-37413-w. Competing Interests: The authors declare no competing interests. Publisher’s note: Springer Nature remains neutral with regard to jurisdictional claims in published maps and institutional affiliations. Open Access This article is licensed under a Creative Commons Attribution 4.0 International License, which permits use, sharing, adaptation, distribution and reproduction in any medium or format, as long as you give appropriate credit to the original author(s) and the source, provide a link to the Cre- ative Commons license, and indicate if changes were made. The images or other third party material in this article are included in the article’s Creative Commons license, unless indicated otherwise in a credit line to the material. If material is not included in the article’s Creative Commons license and your intended use is not per- mitted by statutory regulation or exceeds the permitted use, you will need to obtain permission directly from the copyright holder. To view a copy of this license, visit http://creativecommons.org/licenses/by/4.0/. © The Author(s) 2019 13 Scientific RepoRts | (2019) 9:966 | https://doi.org/10.1038/s41598-018-37413-w