Download
1 / 1
10 likes | 120 Vues
Statistics related to the merging of short and long lead precipitation predictions in the continental U.S. Andy Wood Univ. of Washington Dept. of Civil & Envir. Engr. APPROACH. APPLICATION IN WATER SUPPLY FORECASTING. BACKGROUND

E N D
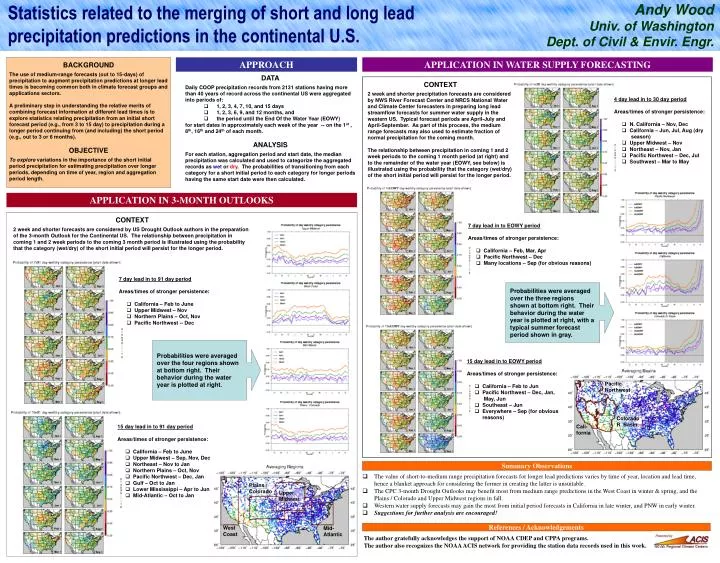
Statistics related to the merging of short and long lead precipitation predictions in the continental U.S. Andy Wood Univ. of Washington Dept. of Civil & Envir. Engr. APPROACH APPLICATION IN WATER SUPPLY FORECASTING BACKGROUND The use of medium-range forecasts (out to 15-days) of precipitation to augment precipitation predictions at longer lead times is becoming common both in climate forecast groups and applications sectors. A preliminary step in understanding the relative merits of combining forecast information at different lead times is to explore statistics relating precipitation from an initial short forecast period (e.g., from 3 to 15 day) to precipitation during a longer period continuing from (and including) the short period (e.g., out to 3 or 6 months). OBJECTIVE To explore variations in the importance of the short initial period precipitation for estimating precipitation over longer periods, depending on time of year, region and aggregation period length. DATA Daily COOP precipitation records from 2131 stations having more than 40 years of record across the continental US were aggregated into periods of: • 1, 2, 3, 4, 7, 10, and 15 days • 1, 2, 3, 6, 9, and 12 months, and • the period until the End Of the Water Year (EOWY) for start dates in approximately each week of the year -- on the 1st , 8th, 16th and 24th of each month. ANALYSIS For each station, aggregation period and start date, the median precipitation was calculated and used to categorize the aggregated records as wet or dry. The probabilities of transitioning from each category for a short initial period to each category for longer periods having the same start date were then calculated. CONTEXT 2 week and shorter precipitation forecasts are considered by NWS River Forecast Center and NRCS National Water and Climate Center forecasters in preparing long lead streamflow forecasts for summer water supply in the western US. Typical forecast periods are April-July and April-September. As part of this process, the medium range forecasts may also used to estimate fraction of normal precipitation for the coming month. The relationship between precipitation in coming 1 and 2 week periods to the coming 1 month period (at right) and to the remainder of the water year (EOWY, see below) is illustrated using the probability that the category (wet/dry) of the short initial period will persist for the longer period. 4 day lead in to 30 day period Areas/times of stronger persistence: • N. California – Nov, Dec • California – Jun, Jul, Aug (dry season) • Upper Midwest – Nov • Northeast – Nov, Jan • Pacific Northwest – Dec, Jul • Southwest – Mar to May APPLICATION IN 3-MONTH OUTLOOKS CONTEXT 2 week and shorter forecasts are considered by US Drought Outlook authors in the preparation of the 3-month Outlook for the Continental US. The relationship between precipitation in coming 1 and 2 week periods to the coming 3 month period is illustrated using the probability that the category (wet/dry) of the short initial period will persist for the longer period. 7 day lead in to EOWY period Areas/times of stronger persistence: • California – Feb, Mar, Apr • Pacific Northwest – Dec • Many locations – Sep (for obvious reasons) 7 day lead in to 91 day period Areas/times of stronger persistence: • California – Feb to June • Upper Midwest – Nov • Northern Plains – Oct, Nov • Pacific Northwest -- Dec Probabilities were averaged over the three regions shown at bottom right. Their behavior during the water year is plotted at right, with a typical summer forecast period shown in gray. Probabilities were averaged over the four regions shown at bottom right. Their behavior during the water year is plotted at right. 15 day lead in to EOWY period Areas/times of stronger persistence: • California – Feb to Jun • Pacific Northwest – Dec, Jan, May, Jun • Southeast – Jun • Everywhere – Sep (for obvious reasons) Pacific Northwest Colorado R. Basin Cali- fornia 15 day lead in to 91 day period Areas/times of stronger persistence: • California – Feb to June • Upper Midwest – Sep, Nov, Dec • Northeast – Nov to Jan • Northern Plains – Oct, Nov • Pacific Northwest – Dec, Jan • Gulf – Oct to Jan • Lower Mississippi – Apr to Jun • Mid-Atlantic – Oct to Jan Summary Observations • The value of short-to-medium range precipitation forecasts for longer lead predictions varies by time of year, location and lead time, hence a blanket approach for considering the former in creating the latter is unsuitable. • The CPC 3-month Drought Outlooks may benefit most from medium range predictions in the West Coast in winter & spring, and the Plains / Colorado and Upper Midwest regions in fall. • Western water supply forecasts may gain the most from initial period forecasts in California in late winter, and PNW in early winter. • Suggestions for further analysis are encouraged! Plains / Colorado Upper Midwest References / Acknowledgements West Coast Mid- Atlantic The author gratefully acknowledges the support of NOAA CDEP and CPPA programs. The author also recognizes the NOAA ACIS network for providing the station data records used in this work.