Download
1 / 10
100 likes | 238 Vues
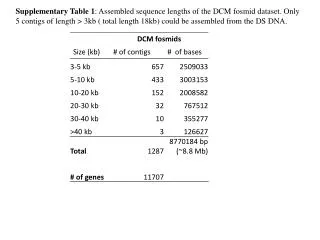
Supplementary Table 1 : Assembled sequence lengths of the DCM fosmid dataset. Only 5 contigs of length > 3kb ( total length 18kb) could be assembled from the DS DNA. Supplementary Table T2: Recruitment by DCM fosmids against DS dataset.

E N D
Supplementary Table 1: Assembled sequence lengths of the DCM fosmid dataset. Only 5 contigs of length > 3kb ( total length 18kb) could be assembled from the DS DNA.
SupplementaryTable T2: Recruitmentby DCM fosmidsagainstDS dataset
SupplementaryTable T3: Distribution of 86462 readscommonto DCM DS and DCM fosmidsdatasets
Supplementary Table T4: Recruitment of DCM DS reads by marine cyanophage genomes. Hit density is calculated by dividing the genome size by the total number of hits from the DS dataset that match the genome.
Supplementary Table T5: Details of the sequencing run of the DCM fosmids A total of approximately 1150 fosmids were chosen for sequencing. The estimated size for each fosmid is ~30 kb, total estimated length to be sequenced is ~34.5 Mb (~10-12 genome equivalents). The fosmids were divided into 12 samples (~100 fosmids per sample) and sequenced using GS FLX 454 pyrosequencing. The up arrows (↑) in the table indicate samples that finally provided much more sequence ( ~30 times more) than other samples ( indicated by a ↓). ↑ ↓ ↑ ↓
Supplementary Table T6. Characteristics of sampling site. (DOC: dissolved organic carbon, TOC: total organic carbon). Nitrate and Phosphate were not detectable
Supplementary Figure S1: Phylogeneticclassification of the DCM DS datasetusingthe SEED database A – Kingdom C - Proteobacteria B - Bacteria D – Alphaproteobacteria 35.98% sequenceswereclassified, e_value 1e05, minimumalignmentlength 50
Supplementary Figure S2: Comparison of the Cyanophage P-SSP7 Genome with fosmid cyanophage contigs. Two large contigs are shown. Comparison was done using TBLASTx. The assembled contigs are syntenic with the Prochlorococcusmarinus subsp. pastoris phages P-SSP7 genome. The color scale shown in the figure indicates the %similarity <30 30-50 50-70 70-80 80-90 90-95 95-100 psbA Integrase Cyanophage P-SSP7 genome contig24 Cyanophage P-SSP7 genome contig41
Supplementary Figure S3: Coverage vs Length of Fosmids (>10 kb) in length. (n = 197)
Supplementary Figure S4: Boxplots of distribution of thelengths of theassembledcontigs per sample, onlythoseassembledsequences are shownthathave a length >3kb (1287 sequences) 10kb 20kb 30kb 40kb SAMPLE_01 SAMPLE_02 SAMPLE_03 SAMPLE_04 SAMPLE_05 SAMPLE_06 SAMPLE_07 SAMPLE_08 SAMPLE_09 SAMPLE_10 SAMPLE_11 SAMPLE_12