
Poverty: Definitions, Measurement, and Analysis
E N D
Presentation Transcript
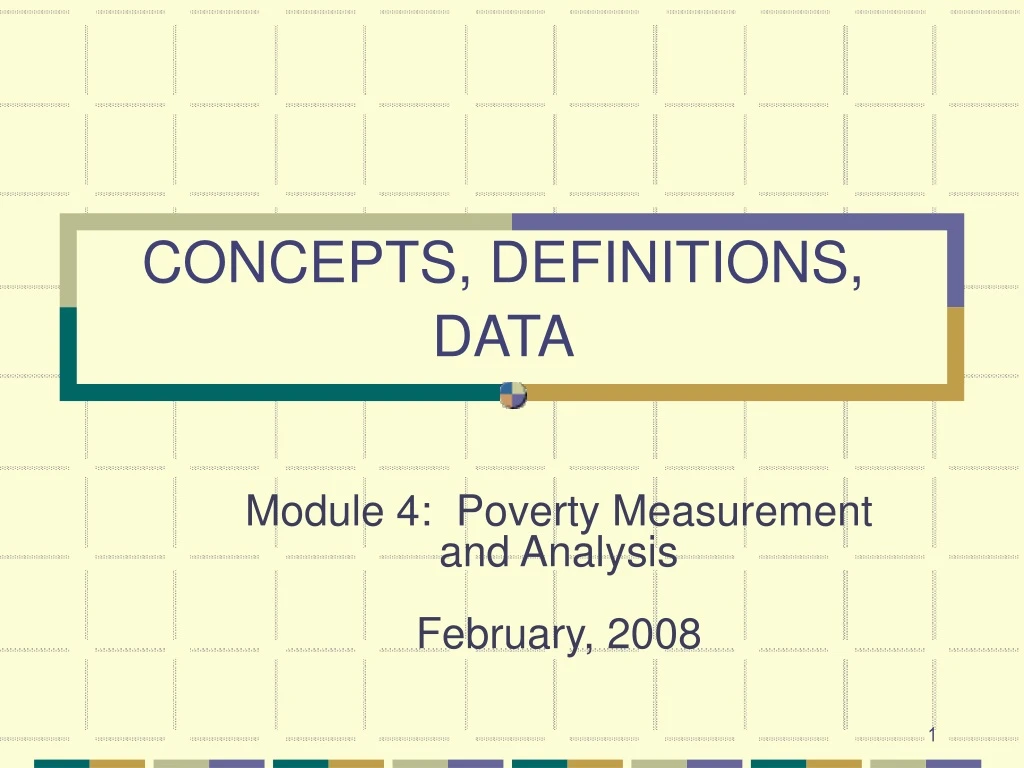
CONCEPTS, DEFINITIONS, DATA Module 4: Poverty Measurement and Analysis February, 2008
Concepts, Definitions and Data What do we mean by “poverty”? • Common definition: • Lack of command over commodities; “..a severe constriction of the choice set [over commodities]” (Harold Watts) • More narrow definition: • Lack of specific consumptions (e.g. too little food energy intake; too little of specific nutrients; too little leisure.) • Less narrow definition: • Poverty as lack of “welfare” e.g., lack of “capabilitiy”: inability to achieve certain “functionings” (“beings and doings”) (Amartya Sen)
Concepts, Definitions and Data Other important definitions • Consumption: destruction of goods and services by use • Expenditure: consumption valued at prices paid (whether or not there was an actual transaction) • Income: maximum possible expenditure on consumption without depleting assets
Why Measure Poverty? • Poverty data can inform, and misinform, anti-poverty policy. • The growth strategy • Has poverty increased? Did growth help the poor? How did relative price changes affect the poor? Who were the losers and who were the gainers from economy-wide policy reforms? (ex-ante versus ex-post) • Social Spending • Who uses public services? At what cost? Who benefits from government subsidies? On average, versus at the margin? Who will be hurt by retrenchment? • Targeted Interventions • Who are the target groups? How should transfers be allocated? How much impact will they have on poverty?
Questions for the analyst: • How do we measure “welfare”? • When do we say someone is "poor"? • How do we aggregate data on welfare into a measure of “poverty”? • How robust are the answers?
The welfare ratio • Common practice emphasizes economic welfare: • add up expenditures on all commodities consumed (with imputed values at local market prices) and • deflate by a poverty line (depending on household size and composition and location/date) • “real expenditure” or “welfare ratio”
Welfare ratio, cont. Welfare ratio:
Welfare ratio, cont. What is Z? Theoretical ideal: =cost of the level of welfare needed to escape poverty; i.e., poverty line Linear approximation: where =basic consumption needs
Issues to consider: • Are people good judges of their own welfare? • What are the basic consumption needs? • Are there substitution effects? Do relative prices vary? • How does the size and composition of the household affect welfare at given consumption? • What about other determinants of well-being (leisure, non-market goods)?
Conceptual problems • The identification problem: how to weight aspects of individual welfare that are not revealed by market behavior. • How do family characteristics (such as size and composition) affect individual welfare at given total household consumption? • How to value command over non-market goods (including some publicly supplied goods)? • How to measure the individual welfare effect of relative deprivation, insecurity, social exclusion? • The referencing problem: determining the reference level of welfare above which is deemed not to be poor — the poverty line in welfare space, which must anchor the money-metric poverty line.
Sources of Information • Survey data • Differ according to: • - the unit of observation (household/individual), • - no. observations over time (cross-section/panel); • -living standards indicator (consumption/income)
Four sets of questions to ask about your data: • Survey design Does the sample frame cover the entire population? Is there a response bias? What is the sample structure (clustering, stratification)? • Goods coverage and valuation Is the goods coverage comprehensive? Is the survey integrated (e.g. price analysis)? Are there valuation problems?
Four sets of questions to ask about your data: • Variability and the time period of survey Is there significant variability over time? Can this be encompassed within the recall period? What are the implications for the choice between consumption and income? • Inter-personal comparisons Is consumption a sufficient statistic? What other variables matter? (Prices, demographics, publicly provided goods)
Alternative measures in practice • Income per capita • Poor indicator when incomes vary; hard to measure • Consumption per equivalent single adult • Problems with forming scales; composition versus size economies; intra-household inequality. • Food-share ("Engel's Law") • Sources of noise: other parameters; problem of income elasticity near unity. Comparability problems. • Nutritional indicators • "Welfarist" critique (welfare and nutrition are different things); nutritional requirements/ anthropometric standards.
Alternative measures in practice • Anthropological methods • Concerns about representativeness and objectivity; lack of integration with other methods. We can learn a lot from “Palanpur”, but it does not represent India. • Subjective/qualitative methods • Can provide useful extra information – to help solve the identification and referencing problems.
Recommendations • Use a comprehensive consumption measure, spanning consumption space • Choice between income and consumption is largely driven by the greater likelihood of accuracy of information on consumption. • Recognize the limitations of consumption based measures; look for supplementary measures, esp access to public services, subjective welfare as a clue to measuring objective welfare.
Further Reading • Martin Ravallion, Poverty Lines in Theory and Practice, Living Standards Measurement Study Working Paper 133, World Bank, Washington DC., 1998. • Martin Ravallion, "Issues in Measuring and Modeling Poverty", Economic Journal, Vol. 106, September 1996, pp. 1328-44. • Martin Ravallion, Poverty Comparisons, Fundamentals of Pure and Applied Economics Volume 56, Chur, Switzerland: Harwood Academic Publishers, 1994.
Construction of a Comprehensive Consumption Indicator Module 4: Poverty Measurement and Analysis February, 2008
Constructing a Consumption Measure • The consumption measure serves as the foundation upon which much of the subsequent poverty analysis rests. • Principles • Should be comprehensive • Retain transparency and credibility • Goal is to be able to rank individuals credibly in terms of welfare
Common Steps • Construct a food consumption measure • Add basic non-food items (from consumption module) • Add other non-food items (other modules) • Add housing expenditures • Add use-value of consumer durables
Aggregating Food Expenditures • Surveys typically ask about food consumption, item by item, over a specific reference period. • In general, the longer (and more disaggregated) the list of items, the higher is food consumption • Sometimes information is asked about consumption in a typical reference period (e.g. month). • This has the attraction of helping to overcome seasonality concerns. • We expect that the longer the reference period, the more expenditures are likely to be biased downwards (recollection difficulties)
Aggregating Food Expenditures • But, the shorter the reference period, the noisier are the expenditure data. • This can hamper poverty comparisons. • Food expenditures should include not only purchased items but also consumption out of home production. • Home production should be valued using local market prices (preferably farm-gate) • Most surveys record not only food expenditures, but also quantities • This information is of use for the construction of poverty lines • When dealing with separate price, quantity and frequency information, on an item by item basis, one often needs to impute certain missing values.
Adding Non-Food Items • The typical consumption module includes a range of non-food items alongside food. • Other parts of the questionnaire may also include certain non-food expenditures (housing section, education and health sections) • Key issue is to distinguish between investmentsand consumption (avoid double counting). • Health expenditures are usually excluded • Lumpy • If we include we should also have a good measure of need.
Adding Non-Food Items • Two Additional omissions: • Leisure • Public goods • The problem is essentially one of pricing: • Should we value an unemployed person’s leisure based on wages in a market to which the individual has no access? • What is the value to individuals of publicly provided goods? • Imputations for public goods and leisure are likely to compromise credibility and usefulness of welfare measures. • We should still document who gets public services, or is unemployed, and examine whether these are poor or rich.
Imputing Housing Expenditures • In most settings a minority of households rent their dwelling, and a majority reside in their own homes. • Home-owners consume a stream of services from their homes. This is precisely what rentors pay for with their rent. • The challenge is thus to impute for home-owners what they would be paying in rent if they were renting rather than owning their house. • Many surveys ask specifically what a household would pay in rent if it were renting. Where credible this number can be used for home owners. • Elsewhere one can try to predict rent paid based on regression models estimated on subset of renting households.
Imputing Durables Consumption • Purchases of irregular, lumpy items such as consumer durables (tv, car, etc.) cannot be directly added to the consumption definition. • Many households are unlikely to make such purchases within the reference period of the survey. • But many will be consuming a stream of services from those items that they own. • Surveys often solicit information on the age of assets owned, original purchase price, and current replacement price. • Based on this information it is possible to calculate the consumption stream of services from the durable as: • Consumption Stream = Current value*(real interest rate + depreciation rate).
The Headcount With Alternative Consumption Aggregations Consumption Aggregate Ecuador NepalBrazil Food Spending plus Basic Non-Food Spending 1.00 1.00 1.00 Food plus Basic Non-Food 0.85 0.91 0.89 Spending Including Energy and Education Spending Above With Actual or Imputed 0.81 n/a n/a Water Expenditures Above With Actual or Imputed 0.70 0.77 0.65 Value of Housing Services Above With Imputed Value 0.68 0.76 n/a of Owned Consumer Durables Do not compare Apples with Oranges!!!
Further Reading • Hentschel and Lanjouw (1995) ‘Aggregating Consumption Components and Setting Demographic Scales: Implications for Measured Poverty in Ecuador’, mimeo, DECRG. • Lanjouw, Prennushi, and Zaidi (1996) ‘Building Blocks for a Consumption-Based Analysis of Poverty in Nepal’, mimeo, DECRG. • Deaton, A. and Zaidi, S. (1999) ‘Guidelines for Constructing Consumption Aggregates for Use as a Money-Metric Welfare Measure’, mimeo, forthcoming LSMS working paper.