Download
1 / 44
440 likes | 525 Vues
Learn how to efficiently navigate the European Social Survey 2002 data by modifying variable labels, adjusting column widths, and changing variable names. This guide helps streamline the process of finding and analyzing relevant variables.

E N D
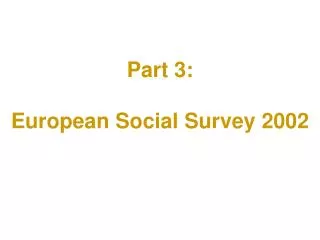
European Social Survey 2002 (GB only) Data Editor as initialised:
Making it easier to find your way round the file • Get a copy of the questionnaire! • Modify variable labels to put question number at beginning • Adjust columns to necessary basics • Change variable names to make them easier to find
You could rewrite all the variable labels from scratch, but for now it was easier to modify them inside the Data Editor
European Social Survey 2002 - GB only Data Editor after modifying variable labels
rename variables (tvtot to pplhlp = a1 to a10) (dscrrce to dscroth = c17_1 to c17_10) (dscrdk to dscrna = c17_dk, c17_ref, c17_nap, c17_na) Change variable names [The lines in red are for variables used in later examples]
Adjust column widths to see more of variable and value labels and mask unneeded columns
An example of awkward labelling European Social Survey 2002
ASK ALL • C16 Would you describe yourself as being a member of a • group that is discriminated against in this country? Yes 1 ASK C17 • No 2 • GO TO C18 • (Don’t know) 8 • C17 On what grounds is your group discriminated • against? PROBE: ‘What other grounds?’ • CODE ALL THAT APPLY • Colour or race 01 • Nationality 02 • Religion 03 • Language 04 • Ethnic group 05 • Age 06 • Gender 07 • Sexuality 08 • Disability 09 • Other (WRITE IN)___________________________ 10 • (Don’t know) 88
This is an example of a multiple response question (with a preceding filter)
Problems for secondary researcher • no indication of data layout • mnemonic variable names • long variable labels with no question number • redundant information at the beginning • useful information at the end (and gets lost) • binary value labels (0, 1)
Here’s what I mean(after scrolling around looking for likely candidates) Could be these: can’t make head or tail of them took a while to find them .
How do I find the right variables? • Adjust column widths as before • Make Label column even wider to reveal labels in full • Scroll down searching for candidates
Data Editor after widening the Label column to reveal variable labels in full This is a sign of lack of experience in SPSS!
How to solve the problem? • Step 1: Add question number and response code to beginning of variable labels • Step 2: Change variable names • Step 3: Get rid of redundant information at beginning of variable labels
Step 1: add question number and response code to beginning of variable label but still with mnemonic variable names
but there’s far too much redundant information at the beginning of the variable labels and the value labels are binary (0,1) not 0-10,88 as on questionnaire
How do we analyse this question? You could run separate frequency counts for each variable, and then add them all up, but it’s far better to use the SPSS command MULT RESPONSE
Mult response • Creates a temporary group variable (which cannot be saved) from several variables • In binary mode it uses a single value across all variables in the group and prints tables with variable labels • In general mode it uses a range of values across all variables in the group and prints tables with value labels
mult response groups = discrim 'Reasons for perceived discrimination' (dscrrce to dscrna (1)) /freq discrim. To run SPSS multiple response in binary mode on the original data
Group DISCRIM Reasons for perceived discrimination (Value tabulated = 1) Pct of Pct of Dichotomy label Name Count Responses Cases Discrimination of respondent's group: co DSCRRCE 82 3.8 4.0 Discrimination of respondent's group: na DSCRNTN 28 1.3 1.4 Discrimination of respondent's group: re DSCRRLG 44 2.0 2.1 Discrimination of respondent's group: la DSCRLNG 5 .2 .2 Discrimination of respondent's group: et DSCRETN 21 1.0 1.0 Discrimination of respondent's group: ag DSCRAGE 50 2.3 2.4 Discrimination of respondent's group: ge DSCRGND 37 1.7 1.8 Discrimination of respondent's group: se DSCRSEX 18 .8 .9 Discrimination of respondent's group: di DSCRDSB 18 .8 .9 Discrimination of respondent's group: ot DSCROTH 74 3.4 3.6 Discrimination of respondent's group: do DSCRDK 1 .0 .0 Discrimination of respondent's group: re DSCRREF 1 .0 .0 Discrimination of respondent's group: no DSCRNAP 1771 82.4 86.3 ------- ----- ----- Total responses 2150 100.0 104.8 0 missing cases; 2,052 valid cases … which produces:
mult response groups = discrim 'Reasons for perceived discrimination' (c17_1 to c17_nap (1)) /freq discrim. To run SPSS multiple response in binary mode on the modified data
Group DISCRIM Reasons for perceived discrimination (Value tabulated = 1) Pct of Pct of Dichotomy label Name Count Responses Cases C17-1: Discrimination of respondent's gr DSCRRCE 82 3.8 4.0 C17-2: Discrimination of respondent's gr DSCRNTN 28 1.3 1.4 C17-3: Discrimination of respondent's gr DSCRRLG 44 2.0 2.1 C17-4: Discrimination of respondent's gr DSCRLNG 5 .2 .2 C17-5: Discrimination of respondent's gr DSCRETN 21 1.0 1.0 C17-6: Discrimination of respondent's gr DSCRAGE 50 2.3 2.4 C17-7: Discrimination of respondent's gr DSCRGND 37 1.7 1.8 C17-8: Discrimination of respondent's gr DSCRSEX 18 .8 .9 C17-9: Discrimination of respondent's gr DSCRDSB 18 .8 .9 C17-10: Discrimination of respondent's g DSCROTH 74 3.4 3.6 C17-DK: Discrimination of Respondent's g DSCRDK 1 .0 .0 C17-ref: Discrimination of respondent's DSCRREF 1 .0 .0 C17-nap: Discrimination of respondent's DSCRNAP 1771 82.4 86.3 ------- ----- ----- Total responses 2150 100.0 104.8 0 missing cases; 2,052 valid cases …not much clearer!
Group DISCRIM Reasons for perceived discrimination (Value tabulated = 1) Pct of Pct of Dichotomy label Name Count Responses Cases C17-1: Discrimination: colour or race C17_1 82 3.8 4.0 C17-2: Discrimination: nationality C17_2 28 1.3 1.4 C17-3: Discrimination: religion C17_3 44 2.0 2.1 C17-4: Discrimination: language C17_4 5 .2 .2 C17-5: Discrimination: ethnic group C17_5 21 1.0 1.0 C17-6: Discrimination: age C17_6 50 2.3 2.4 C17-7: Discrimination: gender C17_7 37 1.7 1.8 C17-8: Discrimination: sexuality C17_8 18 .8 .9 C17-9: Discrimination: disability C17_9 18 .8 .9 C17-10: Discrimination: other grounds C17_10 74 3.4 3.6 C17-DK: Discrimination: don't know C17_DK 1 .0 .0 C17-ref: Discrimination: refusal C17_REF 1 .0 .0 C17-nap: Discrimination: not applicable DSCRNAP 1771 82.4 86.3 ------- ----- ----- Total responses 2150 100.0 104.8 0 missing cases; 2,052 valid cases …shortening the labels helps, but now the variable name is in twice!
There’s another way of doing it which is much better • Temporarily change the codes from binary to sequential • Disable missing values • Add value labels (first variable only) • Use MULT RESPONSE in general mode
As a check on initial values (and not just for this example) you can use list var c17_1 to c17_10 / cases 5.
C17_1 C17_2 C17_3 C17_4 C17_5 C17_6 C17_7 C17_8 C17_9 C17_10 1 0 0 0 0 0 1 0 0 0 1 1 1 1 1 0 0 0 0 0 1 0 0 0 0 0 0 0 0 0 1 0 0 0 0 0 0 0 0 0 0 0 0 0 0 0 0 0 0 1 Number of cases read: 5 Number of cases listed: 5 List C17_1 to C17-10 before recoding (first 5 cases only)
temp. • recode • c17_1 to c17_10 (6 thru hi = sysmis) • /c17_2 (1=2) • /c17_3 (1=3) • /c17_4 (1=4) • /c17_5 (1=5) • /c17_6 (1=6) • /c17_7 (1=7) • /c17_8 (1=8) • /c17_9 (1=9) • /c17_10 (1=10) • /c17_dk (1=11) • /c17_ref (1=12) • /c17_nap (1=13) • /c17_na (1=14). Step 1:Temporarilychange values from binary to sequential
C17_1 C17_2 C17_3 C17_4 C17_5 C17_6 C17_7 C17_8 C17_9 C17_10 1 0 0 0 0 0 7 0 0 0 12 3 4 5 0 0 0 0 0 1 0 0 0 0 0 0 0 0 0 1 0 0 0 0 0 0 0 0 0 0 0 0 0 0 0 0 0 0 * Number of cases read: 5 Number of cases listed: 5 List first 5 cases after recoding List C17_1 to C17-10 after recoding (first 5 cases only) (NB: the * = 10: it would print with format F2.0)
missing values c17_1 to c17_na ( ). Step 2: Disable missing values
value labels c17_1 (1) 'Colour or race' (2) 'Nationality' (3) 'Religion' (4) 'Language' (5) 'Ethnic group' (6) 'Age' (7) 'Gender' (8) 'Sexuality' (9) 'Disability' (10) 'Other' (11) "Don't know" (12) 'Refusal' (13) 'Not applicable' (14) 'No answer'. Step 3: Specify new value labels (1st variable only)
mult response groups = discrim 'Q17: Perceived reasons for discrimination' (c17_1 to c17_nap (1,14)) /freq discrim. Step 4: Specify group variable and get frequency count
Group DISCRIM Q17 Perceived reasons for discrimination Pct of Pct of Category label Code Count Responses Cases Colour or race 1 82 3.8 4.0 Nationality 2 28 1.3 1.4 Religion 3 44 2.0 2.1 Language 4 5 .2 .2 Ethnic group 5 21 1.0 1.0 Age 6 50 2.3 2.4 Gender 7 37 1.7 1.8 Sexuality 8 18 .8 .9 Disability 9 18 .8 .9 Other 10 74 3.4 3.6 Don't know 11 1 .0 .0 Refusal 12 1 .0 .0 Not applicable 13 1771 82.4 86.3 ------- ----- ----- Total responses 2150 100.0 104.8 0 missing cases; 2,052 valid cases Perceived reasons for discriminationThis is much clearer (if you can read it!)
mult response groups = discrim 'Q17: Perceived reasons for discrimination' (c17_1 to c17_10 (1,10)) /freq discrim. To produce the table only for those who actually answered the question, we simply change the mult response command to:
Group DISCRIM Q17 Perceived reasons for discrimination Pct of Pct of Category label Code Count Responses Cases Colour or race 1 82 21.8 29.4 Nationality 2 28 7.4 10.0 Religion 3 44 11.7 15.8 Language 4 5 1.3 1.8 Ethnic group 5 21 5.6 7.5 Age Group DISCRIM Q17 Perceived reasons for discrimination Pct of Pct of Category label Code Count Responses Cases Colour or race 1 82 21.8 29.4 Nationality 2 28 7.4 10.0 Religion 3 44 11.7 15.8 Language 4 5 1.3 1.8 Ethnic group 5 21 5.6 7.5 Age 6 50 13.3 17.9 Gender 7 37 9.8 13.3 Sexuality 8 18 4.8 6.5 Disability 9 18 4.8 6.5 Other 10 74 19.6 26.5 ------- ----- ----- Total responses 377 100.0 135.1 1,773 missing cases; 279 valid cases Group DISCRIM C17 Perceived reasons for discrimination Pct of Pct of Category label Code Count Responses Cases Colour or race 1 82 21.8 29.4 Nationality 2 28 7.4 10.0 Religion 3 44 11.7 15.8 Language 4 5 1.3 1.8 Ethnic group 5 21 5.6 7.5 Age 6 50 13.3 17.9 Gender 7 37 9.8 13.3 Sexuality 8 18 4.8 6.5 Disability 9 18 4.8 6.5 Other 10 74 19.6 26.5 ------- ----- ----- Total responses 377 100.0 135.1 1,773 missing cases; 279 valid cases Perceived reasons for discrimination (valid cases only)