Reactor Systems and Separation Processes Summary
300 likes | 418 Vues
Explore endothermic vs. exothermic reactions, equilibrium versus kinetics, and temperature effects on reaction rates. Learn about the integration of reactors with thermal and mechanical energy systems. Dive into separation systems and distillation columns trade-offs, rules, and sequences. Understand the heuristic rules, heuristic conflicts, and mole fraction calculations for distillation sequences. Discover the heat recovery system targets, energy cost considerations, and the heat cascade algorithm for optimal performance.

Reactor Systems and Separation Processes Summary
E N D
Presentation Transcript
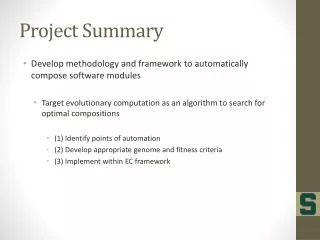
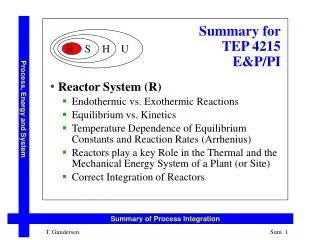
Summary for TEP 4215 E&P/PI R S H U • Reactor System (R) • Endothermic vs. Exothermic Reactions • Equilibrium vs. Kinetics • Temperature Dependence of Equilibrium Constants and Reaction Rates (Arrhenius) • Reactors play a key Role in the Thermal and the Mechanical Energy System of a Plant (or Site) • Correct Integration of Reactors Process, Energy and System Summary of Process Integration T. Gundersen Sum 1
R S Summary for TEP 4215 E&P/PI R S H U • Reactor / Separator Interface (R/S) • Focus of the Discussion was based on the Definition and Use of the following Terms: • Degree of Conversion (Extent of Reaction) • Selectivity • Yield (Reactor and Process) • Recycle Rate Process, Energy and System FF RF P RX PX YR = X · S BP RR YP = X · S · (1 + W) Summary of Process Integration T. Gundersen Sum 2
Summary for TEP 4215 E&P/PI R S H U • Separation System (S) • Economical Trade-offs in Distillation Columns • Operating Cost vs. Investment Cost • Number of Stages, Reflux and Pressure • Combinatorial Issues & Heuristic Rules related to the Sequence of Distillation Columns • Heat Integration Opportunities between Columns (Condenser / Reboiler) • Briefly about Evaporators • Multi-effect, Forward/Backward Feed, BPR Process, Energy and System Summary of Process Integration T. Gundersen Sum 3
Sequence of Distillation Columns Problem Definition by Thompson and King, AIChE Jl, 1972: ”Given a mixture of N chemical components that is to be separated into N pure component products by using a selection of M separation methods” Process, Energy and System Separation Systems Sum 4 T. Gundersen
Sequence of Columns B C D A B C A B C B C D 2 comps. 1 sequence 3 comps. 2 sequences 4 comps. 2x(1+3 comps.) + 1x(2+2 comps.) 2x2 + 1 = 5 sequences 5 comps. 2x(1+4 comps.) + 2x(2+3 comps.) 2x5 + 2x2 = 14 sequences 6 comps. 2x(1+5 comps.) + 2x(2+4 comps.) + 1x(3+3 comps.) 2x14 + 2x5 + 2x2 = 42 sequences A B B C C D C D A B B C A B C D A B C D A B C D A B C D Process, Energy and System Separation Systems T. Gundersen Sum 5
Sequence of Distillation Columns Selected Heuristic Rules H1: Favor Separation of the most Volatile Component H2: Favor near-Equimolar Separation H3: Favor Separation of the most Plentiful Component H4: Favor Simple Separations << H5: Delay Separation of Sharp Splits >> Process, Energy and System Heuristics cause Conflicts, some can be Quantified, others just ”cast a vote”, their main use is to Eliminate Sequences !! Separation Systems T. Gundersen Sum 6
Comp.NameMole Frac.α=Ki/Kj”CES” A Propane 0.05 2.00 5.26 B i-Butane 0.15 1.33 8.25 C n-Butane 0.25 2.40 114.50 D i-Pentane 0.20 1.25 13.46 E n-Pentane 0.35 Example – Distillation Sequence Process, Energy and System Nadgir & Liu, AIChE Journal, 1983: f = min (D/B, B/D) Δ = (α – 1)100 CES = f α Separation Systems T. Gundersen Sum 7
Summary for TEP 4215 E&P/PI R S H U • Heat Recovery System (H) • Targets for best Performance • Minimum Energy from the Heat Cascade • Minimum Energy Cost with Multiple Utilities from the Grand Composite Curve • Fewest Number of Units from the (N – 1) Rule • Minimum Area from Spaghetti Design (“Bath”) • Total Annual Cost vs. ΔTmin • 3-Way Trade-off (Area, Energy and Units) Process, Energy and System Summary of Process Integration T. Gundersen Sum 8
Heat Cascade as Algorithm/Procedure (1) (0) Given Set of Hot Stream Temperatures: TH , i = 1,nH , Set of Cold Stream Temperatures: TC , j = 1,nC, and Set of mCps, i = 1,nH , j = 1,nC (1) Calculate Shadow Temperatures from Hot Streams: THS , TH,S=TH−ΔTmin (2) Calculate Shadow Temperatures from Cold Streams: TCS , TC,S=TC+ΔTmin (3) Obtain Total Set of Hot Stream Temperatures, THT, by merging and sortingTH and TCSNotice that dim (THT)= nH + nC (4) Obtain Total Set of Cold Stream Temperatures, TCT, by merging and sortingTC and THSNotice that dim (TCT) = nC + nH Remove possible Duplicates in THT and TCT. The number of Temperature Intervals is then K = dim (THT) − 1 Temperature Intervals are now obtained by using one Temperature from THT and one from TCT starting at the highest Temperatures (7) Identify Heat Flows from all the Hot Streams to the respective Temperature Intervals based on mCp values and Interval Temperatures Process, Energy and System Summary of Process Integration T. Gundersen Sum 9
Heat Cascade as Algorithm/Procedure (2) (8) Identify Heat Flows from the respective Temperature Intervals to all the Cold Streams based on mCp values and Interval Temperatures (9) Calculate the Enthalpy (Heat) Balance (Surplus or Deficit) for each Temperature Interval (10) Cascade Heat from the first Interval to the second, and from the second to the third Interval. Continue to the end of the Cascade (11) If all Residuals (i.e. Heat from one Interval to the next) are non-negative (Rk≥ 0), then no External Heating is required, QH,min = 0, and Minimum External Cooling is obtained as the Residual from the last Interval, i.e. QC,min = RK If at least one Residual is negative, then Minimum External Heating and Cooling are: QH,min = − min (Rk) , k = 1,K-1 , QC,min = RK + QH,min (13) The Process Pinch is the Interval Temperature with the most negative Residual which has zero heat flow after adding Minimum External Heating to the Cascade Process, Energy and System Summary of Process Integration T. Gundersen Sum 10
Example: Stream Data from Assignment 3 Stream Ts(°C) Tt (°C) mCp (kW/°C) ΔH (kW) H1 170 60 3.0 330 H2 150 30 1.5 180 C1 20 135 2.0 230 C2 80 140 4.0 240 Process, Energy and System ΔTmin = 10°C THT = 170, 150, 145, 90, 60, 30 TCT = 160, 140, 135, 80, 50, 20 K = 6 – 1 = 5 Summary of Process Integration T. Gundersen Sum 11
Example: Stream Data from Assignment 3 170°C 160°C 60 kW H1 + 60 R1=60 150°C 140°C 15 kW 20 kW + 2.5 7.5 kW C2 R2=62.5 145°C 135°C Process, Energy and System 165 kW 220 kW - 82.5 82.5 kW 110 kW R3=−20 H2 90°C 80°C 45 kW 60 kW + 75 C1 90 kW R4=55 60°C 50°C 60 kW - 15 45 kW R5=40 30°C 20°C Summary of Process Integration T. Gundersen Sum 12
WS-8 cont. Vertical Design: 2 −3 and 1 − 4 Criss-Cross Design: 2 −4 and 1 − 3 T(°C) 350 4 3 2 1 300 250 Process, Energy and System 200 Q(kW) 0 500 1000 Explanation: Optimal Distribution of (UΔT) - not only ΔT Investment Cost T. Gundersen Sum 13
Summary for TEP 4215 E&P/PI R S H U • Heat Recovery System (H) • Design of Network using PDM • Decomposition at Pinch (Process and Utility Pinch) • Start the Design at the Pinch • Pinch Exchangers and Requirements • mCp Rules: mCpout≥mCpin • Population: nout≥nin • Focus on ΔT, not ΔH • Tick-off Rule • Check Design against Targets !! Process, Energy and System Summary of Process Integration T. Gundersen Sum 14
Summary for TEP 4215 E&P/PI R S H U • Heat Recovery System (H) • Optimization of Heat Exchanger Networks • Stream Splitting (start with: α/β= mCp1/mCp2) • Heat Load Loops and Paths • The HEN Design Process as a “Flow Diagram” • Retrofit Design of Heat Exchanger Networks • Targeting for good value of HRAT • XP Analysis (QP = QPP + QPH + QPC) • Shifting to reduce XP Heat Transfer • UA Analysis (existing and new) followed by Loops and Paths for maximum Reuse of existing Units Process, Energy and System Summary of Process Integration T. Gundersen Sum 15
Exam 2 June 2008 – Retrofit (60%) mCp = 50 kW/°C mCp = 60 kW/°C Process, Energy and System mCp = 80 kW/°C mCp = 40 kW/°C ΔTmin = 10°C mCp = 20 kW/°C Summary of Process Integration T. Gundersen Sum 16
Exam 2008 Process, Energy and System Simplified Cascade with Supply Temperatures only Summary of Process Integration T. Gundersen Sum 17
H1 I Ca H2 II III III C1 H II C3 C2 I Cross-Pinch Analysis Exam 2008 110° mCp (kW/°C) 180° 121.67° 4300 50° [60] 200° 77.5° 70° 110° [40] Cb 300 40° 105° [20] Process, Energy and System 1300 190° 145° 100° [80] 3600 3600 60° 130° [50] 3500 100° Summary of Process Integration T. Gundersen Sum 18
H1 I Ca mCp (kW/°C) 180° 121.67° 50° [60] 200° 4300-y 145° 190° [80] IV IV H 3600-y 0 + y 60° C2 C3 130° I [50] 3500 “Shifting” Exam 2008 TH1 Process, Energy and System y can be found by ΔTmin requirements y = 1500 kW Next: What about Investments ?? Summary of Process Integration T. Gundersen Sum 19
mCp (kW/°C) H1 180° 50° 96.67° 155° IV I [60] Ca 2800 200° H2 77.5° 70° 110° [40] II Cb III 300 40° 105° III [20] C1 1300 100° 163.75° 190° 145° H IV II [80] 2100 3600 1500 60° C2 C3 130° I [50] 3500 Exam 2008 Process, Energy and System Next: UA Analysis for maximum Reuse of existing Exchangers Summary of Process Integration T. Gundersen Sum 20
Summary for TEP 4215 PI R S H U • Separation/Heat Recovery Interface (S/H) • Columns integrated above/below Pinch • Condenser above, Reboiler below • Which Pinch – Columns often create Pinch • Extended Grand Composite Curve (Andrecovich) • Distinguish Columns from “Background” Process • Evaporators and Heat Integration • The Tool is again the Grand Composite Curve • Play with Pressure and the Number of Effects Process, Energy and System Summary of Process Integration T. Gundersen Sum 21
Summary for TEP 4215 PI R S H U • Heat Recovery / Utility Interface (H/U) • Correct Integration of Heat Pumps (open/closed) • Correct Integration of Turbines (back pressure or extraction vs. condensing turbines) • Co-production of Heat & Power (cogeneration) • The quantitative Tool with Information about Load (heat duty) and Level (temperature) is: • The Grand Composite Curve • Modified Temperatures are important !! Process, Energy and System Summary of Process Integration T. Gundersen Sum 22
Summary for TEP 4215 PI R S H U • Utility System (U) • Not treated in much Detail in this Course • Topics could (or should?) have been: • Design of Steam Systems (turbines, boilers, deaerators, etc.) • Design of fired Heaters (Furnaces) with optimal preheat of Combustion Air • Design of Refrigeration Cycles including Integration with the Process (“economizers”) • Etc., etc. Process, Energy and System Summary of Process Integration T. Gundersen Sum 23
Summary for TEP 4215 PI R S H U • Other Topics • Optimization: Only Demo with Examples from Heat Recovery using Math Programming • Forbidden Matches & Extended Cascade is relevant • Operational Aspects (especially related to Flexibility and Controllability) • The Importance of Topology (Structure) • Extensions of the Pinch Principle • Heat Pinch, Mass Pinch, Water Pinch and Hydrogen Pinch (whenever an “amount” has a “quality”) Process, Energy and System Summary of Process Integration T. Gundersen Sum 24
Reactor More on the Grand Composite Curve 160° Compressor C2 130° Condenser Process, Energy and System 210° 270° Distillation Column 50° H1 160° 210° C1 Feed Reboiler 60° 220° Product H2 Heat Integration −Introduction T. Gundersen Extra 01
ST 270ºC - - - - - - - 250ºC 720 kW H1 + 720 230ºC - - - - - - - 210ºC 500 kW C2 180 kW - 520 200 kW 220ºC - - - - - - - 200ºC 2000 kW 720 kW - 1200 880 kW 800 kW 180ºC - - - - - - - 160ºC 360 kW 400 kW + 400 C1 440 kW 160ºC - - - - - - - 140ºC 1800 kW 1980 kW H2 + 180 70ºC - - - - - - - - 50ºC 220 kW + 220 60ºC - - - - - - - - 40ºC ΔTmin= 20°C CW Grand Composite Curve is based on the Heat Cascade Process, Energy and System The necessary data are modified Temperatures and the corresponding Heat Flows Heat Integration −Targeting T. Gundersen Extra 02
T' (°C) ST HP 250 T0’ = 260 QH,min = 1000 + 720 MP 200 T1’ = 220 R1 = 1720 - 520 150 LP T2’ = 210 R2 = 1200 - 1200 100 Question: Is this another Pinch? T3’ = 170 R3 = 0 + 400 50 T4’ = 150 R4 = 400 + 180 Q (kW) CW 0 T5’ = 60 R5 = 580 + 220 0 500 1500 T6’ = 50 QC,min = 800 CW Grand Composite Curve (or Heat Surplus Diagram) Process, Energy and System Heat Integration −Targeting T. Gundersen Extra 03
ST T0’ = 260 QH,min = 1000 + 720 T1’ = 220 R1 = 1720 - 520 T2’ = 210 R2 = 1200 - 1200 T3’ = 170 R3 = 0 Answer: No + 400 T4’ = 150 R4 = 400 + 180 0 T5’ = 60 R5 = 580 + 220 T6’ = 50 QC,min = 800 CW Grand Composite Curve T' (°C) HP 250 MP 200 Process, Energy and System 150 LP 100 50 Q (kW) CW 0 500 1500 Heat Integration −Targeting T. Gundersen Extra 04
T(°C) 300 HP 250 PP MP UP 200 150 UP LP 100 50 Q(kW) CW 0 0 500 1000 1500 2000 2500 “New” CCs based on Heat Surplus and Deficit Part of Gr.CC and balanced by Hot and Cold Utilities (not representative for Area demand) Process, Energy and System Another way of showing it is not another Process Pinch Heat Integration −Targeting T. Gundersen Extra 05
T(°C) True Balanced Composite Curves with Utilities (Notice difference in shape and scale) 300 250 PP 200 Process, Energy and System 150 UP UP 100 50 Q(kW) 0 0 1000 2000 4000 6000 7000 3000 5000 Heat Integration −Targeting T. Gundersen Extra 06