Download
1 / 45
450 likes | 609 Vues
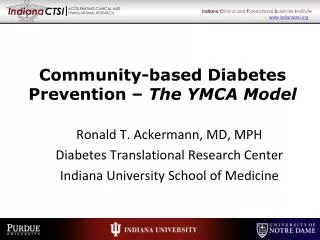
Healthy Cities – Diabetes Prevention . Policy changes in the urban built environment: implications for diabetes prevention. Gillian Booth Li Ka Shing Knowledge Institute, St. Michael’s Hospital Institute for Clinical Evaluative Sciences . The ‘Built Environment’.

E N D
Healthy Cities – Diabetes Prevention Policy changes in the urban built environment: implications for diabetes prevention Gillian Booth Li KaShing Knowledge Institute, St. Michael’s Hospital Institute for Clinical Evaluative Sciences
The ‘Built Environment’ Our physical surroundings, including buildings, parks, schools, road systems, and other infrastructure that we encounter in our daily lives
Rapid shifts in urbanization • Rural to urban migration • Fewer opportunities for physical activity and healthy eating WHO estimates 350 million people worldwide with diabetes
Greater reliance on automobiles More time spent in cars -> higher rates of obesity Frank LD et al Am J Prev Med 2004
The built environment as a potential target for intervention
Features of Walkable Neighbourhoods • More compact/dense • Grid-like street pattern (shorter blocks) • Mixed land use • Destinations within walking distance More walkable neighbourhoods more walking
Suburban design discourages walking and increases reliance on cars • Large lot sizes (more sprawl) • Less connected streets (longer blocks) • Purely residential zoning • Few walkable destinations Less walkable neighbourhoods less walking, less physical activity and more obesity
Theoretical link between urban built environment and type 2 diabetes Built Environment Walkability, parks, recreational spaces Walking, bicycling, other activities Weight gain, overwt & obesity Type 2 Diabetes
Unable to prove causal relationship Unable to randomize people to live in one community over another Limitations of prior studies
People living in neighborhoods with more green and open spaces had 13% lower rates of Type 2 diabetes. Astell-Burt et al., Diabetes Care 2014
Perceived supportive environment for physical activity • 17% less likely to be insulin resistant • 39% less likely to develop type 2 diabetes Auchincloss et al., Arch Intern Med 2009
30 - 50,000 50 - 75,000 75 - 100,000 100- 150,000 150- 375,000 Neighbourhood Environments and Resources for Healthy Living: A Focus on Diabetes in Toronto, 2007
Our walkability index Population density* Residential density* Land use mix Walkable destinations* Street connectivity* Sprawling vs. compact Neighbourhoods Zoning differences Lay out of streets (short vs. long blocks; grid-like vs. curvilinear or cul-de-sacs)
Characteristic (%) Q5:Q1 ratio (highest to lowest walkability score) Walk or bicycle to work 3.09 1.72 Public transit to work Drive to work 0.57 Obesity* 0.75 Transportation behaviours and obesity rates in Toronto by walkability quintile *CCHS population, age 30-64 yrs; Transportation Tomorrow Survey, p < .001 for all Glazier et al., Plos One 2014
Rate Ratio of Lowest vs. Highest scores (Q1:Q5) Population density Residential density Walkable destinations Street connectivity
Density, Destinations and Transportation Choices (Glazier et al., 2014)
Walkable Destinations: Density and Destinations Spatial Concordance Between Residential Density and Availability of Walkable Destinations. (Glazier et al., 2014)
Are individuals living in more walkable areas at lower risk of developing diabetes?
Overview of methods Neighbourhood level data Provincial health records + Walkability All residents living in a given area Postal code of residence Follow whole populations over time
Walkability and Diabetes Incidence Study population = 1,658,027 adults age 30-64 yrs, living in Toronto, free of diabetes at baseline April 1, 2005 March 31, 2010 Diabetes* * based on validated algorithm using records from hospitalizations and physician service claims Booth et al., Diabetes Care, 2013
Study population N=1,658,027 212,882 1,445,145 Recent immigrants Long term residents Booth et al., Diabetes Care, 2013
Young and middle-aged men followed for 5 years Booth et al., Diabetes Care, 2013
Limitations • To what extent does ‘self-selection’ (individual preference) account for findings • Would changes in community design promote physical activity, reduce BMI and decrease the likelihood of developing diabetes?
Are individuals living in more walkable areas at lower risk of developing diabetes after accounting for ethnicity, income and obesity-related health conditions?
How do we get multiple sectors and agencies involved in translating evidence into planning and practice?
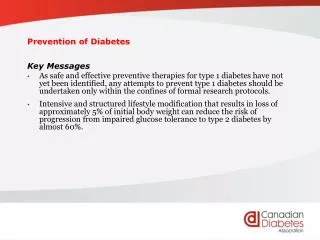
Potential policy interventions • Changing standards for new developments • Restructuring of existing communities • Zoning changes, tax incentives or other initiatives to support healthy food retailers or other services to move into high need areas • Expanding transit options, adding walking paths, cycling infrastructure • Target neighbourhoods with unsupportive environments for diabetes prevention initiatives
The objectives of the event were: 1. Disseminate research findings to key stakeholders 2. Engagekey stakeholders to explore potential applications 3. Provide a forum for sharing success stories and barriers to achieving changes in the built environment 4. Establish partnershipswith researchers, planning and public health Integrated KT Event: Multi-Sectoral Engagement
Involving Municipalities, Provincial Gov’t & Relevant Agencies
Research priorities • How effective are current or upcoming policy initiatives? • Ability to study natural experiments • Need to build in evaluation of ongoing initiatives • Best return on investments • Economic analyses?
Next steps to support policy and planning related to the built environment
Summary • Providing more opportunities to be physically active is a key step the battle against obesity and diabetes • Interventions targeting the built environment that encourage physical activity may have substantial health benefits for the population • Challenges in translating research findings into policy and planning initiatives will require collaboration across sectors and levels of government
Built Environment and Diabetes • Co-Investigators • Jim Dunn • Rick Glazier • Doug Manuel • Flora Matheson • Rahim Moineddin • Laura Rosella • Nancy Ross Project Team Marisa Creatore Medical Geographers: Peter Gozdyra & Jonathan Weyman Students/Fellows: Ghazal Fazli Jane Polsky Vered Kaufman-Shriqui Sara Guilcher Maria Chiu Collaborators Jack Tu, ICES Public Health Ontario Region of Peel Toronto Public Health