Download
1 / 5
50 likes | 145 Vues
Visualize mineral mass changes in soils over time at a specific location using delta plots. Easily switch between linear, log, or delta scales. Monitor mineral saturation states, precipitation, and dissolution rates.

E N D
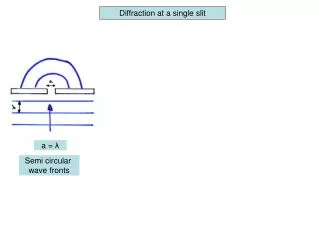
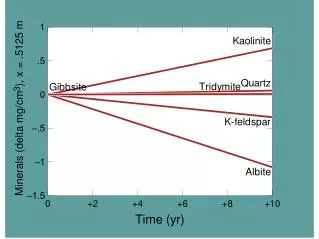
Use a delta plot to see the change in mineral mass at a single location.
Variable type → Minerals → ... Quickly change units Linear, log, or delta plots Plot mineral mass formed along a soil profile at different times.
Variable type → Mineral saturation → ... Uncheck to adjust scale to your liking Plot the saturation state of various minerals for a single time.
Variable type → System parameters → ... Display mineral precipitation or dissolution rates.