Download
1 / 17
170 likes | 331 Vues
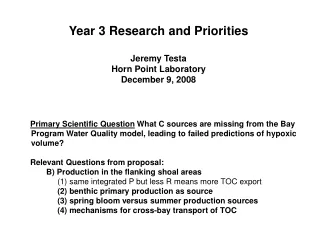
Box Model Analysis of the Corsica River 2005–2006. Michael Kemp Maureen Brooks Jeremy Testa. Corsica River Study Site. CONMON. Cedar Point. Box 3. Possum Point. SONE. The Sill. Box Model Boundary. Box 2. Sycamore Point. Box 1. WWTP.

E N D
Box Model Analysis of the Corsica River 2005–2006 Michael Kemp Maureen Brooks Jeremy Testa
Corsica River Study Site CONMON Cedar Point Box 3 Possum Point SONE The Sill Box Model Boundary Box 2 Sycamore Point Box 1 WWTP
Precipitation – Evaporation Runoff, River Flow Outflow Corsica River Chester River Waste- water Non - Advective Exchange Single Box Model Qp-e Qr Qout SChester SCorsica Qww ECh-Co Water Balance: Qout = Qr + Qp-e + Qww Salt Balance: ECh-Co = (Qout) [SCo/(SCh-SCo)]
Caveates in this Analysis Analyses generated thus far are very preliminary because they are based on incomplete data. Stream flow & nutrient loading rates estimated using tentative data & untested assumptions on weighting & extrapolation. Point-source and atmospheric inputs taken from different years, with “interpolation” to common year. Weighted extrapolation from USGS gauged site. Many observed patterns are very clear and may be robust (i.e., strong signal showing through noise of questionable data.
2006 1 68 70.2 275 1.2 Single Box Model: Water-Transport (103 m3 d-1) 2005 1 116 118.2 Corsica River Chester River 1040 1.2 2005: April to October Transports 2006: May to October Transports
2006 20 211 77 21 323 = 214 Single Box Model: DINTransport (kg d-1) 2005 20 364 25 6 Corsica River Chester River 23 21 402 = 265 mmol m-2 h-1 (net uptake)
0 323 1080 3772 506 4023 = 3.28 Single Box Model: DIPTransport (kg d-1) 0 556 756 Corsica River Chester River 438 506 133 = 0.11 mmol m-2 h-1 (net release)
Single Box Model: Biogeochemical Rates 2005 2006 Net DIN Production (mmol N m-2 h-1): Net DIP Production (mmol P m-2 h-1): Denitrification (mmol m-2 h-1): Net Ecosystem Prod. (g C m-2 y-1): Water Residence Time (FFW, d): -265 -214 0.11 3.28 267 266 -1 -37 85 145
5 51 15 161 4 6 105 21 3 185 167 = 530 = 144 DIN Transport in 2-Box Model (kg d-1) 5 88 15 276 37 24 Chester River Box 1 Box 2 55 772 21 209 943 = 683 mmol m-2 h-1 (net uptake) = 601 mmol m-2 h-1 (net uptake)
0 0.2 0 0.7 2.9 2.5 5.1 11.8 1.4 5.9 6.1 DIP Transport in 2-Box Model (kg d-1) 0 0.4 0 1.2 1.1 2.3 Chester River Box 1 Box 2 1.8 92.4 1.4 0.3 91.4 = 4.14 mmol m-2 h-1 (net uptake, release) = 36.9 mmol m-2 h-1 (net release) = 7.7 = 2.5
Non-point Precip 9.1 15.7 22.8 3.8 2.1 Non- point 3.6 5.2 3.9 92.5 Box 1 Box 2 Box 3 Output Net Flux 12.4 17.3 14.5 4.6 (-100.6) (-43.9) (-28.1) Point Non- Advective Chester River Corsica River DIN Transport in 3-Box Model (kg d-1)
DIN Flux DIP Flux May Jun Jul Aug Sep Oct Monthly Net Fluxes of DIN & DIP: 1-Box
DIN Flux DIP Flux May Jun Jul Aug Sep Oct Monthly Net Fluxes of DIN & DIP: 2-Box Box 1 Box 2 Box 1 Box 2
Mean Net Fluxes of DIN & DIP: 3-Box DIN Flux Box 1 Box 2 Box 3 DIP Flux Box 1 Box 2 Box 3
Key preliminary conclusions • Consistent high rates of net DIN uptake within Corsica(retention or transformation?) • 2) NetDIP production within Corsica indicates system heterotrophy (mining P from sediments or transforming PP inputs?) • Corsica appears to import substantial DIN from Chester (transported to middle of estuary, Box 2) • 4) Clear regional trends in transport and net fluxes
Problems • ~Sparse WQ data – difficult to represent • concentration distribution along salinity gradient. • 2) Need diffuse source water flow and nutrient loading (TN, NH4, NO3, TON, TP, DIP) for major tribs. • 3) Need more point-source loading rates. • 4) Need time-series atmospheric loading rates. • 5) Need algorithms for estimating water flow and nutrient loading in non-monitored years.
Spatial Distribution of Water Depths Hypsograph of distribution of system area and volume at various water depths Implications for benthic production with improved water clarity? Small increase in Secchi (0.7-1.0 m) yields large increase in photic bottom from 40-90%