Download
1 / 38
380 likes | 486 Vues
Explore the rising suburban poverty rates from various data sources. Learn about the official and supplemental poverty measures, criticisms, and trends in Nassau/Suffolk counties, 2007-2012. Discover how the Census Bureau measures and analyzes poverty status over time.

E N D
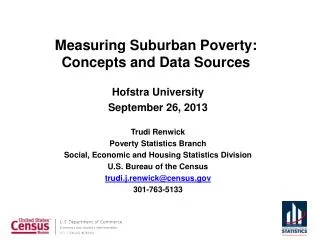
Measuring Suburban Poverty: Concepts and Data Sources Hofstra University September 26, 2013 Trudi Renwick Poverty Statistics Branch Social, Economic and Housing Statistics Division U.S. Bureau of the Census trudi.j.renwick@census.gov 301-763-5133
Sources of Poverty Data • Current Population Survey - national • Decennial Census - historical • American Community Survey • Single year - geographies 65,000+ • Multi-year - smaller areas • Small Area Income and Poverty Estimates • School district estimates
Official Poverty Measure The 2012 official poverty rate for the nation was 15.0 percent No change from last year 46.5 million people in poverty An increase of 2.7 percentage points since 2007 Official poverty threshold for a family with two adults, two children in 2012 was $23,283 Current Population Survey Annual Social and Economic Supplement Detailed tables, historical tables, customized tables using Table Creator http://www.census.gov/prod/2011pubs/p60-239.pdf
Real Median Household Income and • Poverty Rate: 1967 to 2012 Income in thousands (2012 dollars) Recession $51,000 $42,900 15.0% 14.2% Note: Income rounded to nearest $100. Source: U.S. Census Bureau, Current Population Survey, 1968 to 2013 Annual Social and Economic Supplements. 5
The Current Population Survey enables researchers to look at poverty over long time periods for larger geographic entities. Nationally, we can see a trend toward a larger share of the poor living in suburbs. Source: Current Population Survey Annual Social and Economic Supplement
Poverty rates in suburban areas continue to be lower than inside principal cities or outside metropolitan areas. Source: Current Population Survey Annual Social and Economic Supplement
Nationally over the past twelve years, poverty rates and the number of poor people have grown fastest in the suburbs. Source: Current Population Survey Annual Social and Economic Supplement
ACS Data on Suburbs: Percent Change in Poverty Rates 2008-2012 Source: American Community Survey
ACS data on Nassau/Suffolk Counties • 2007 to 2012 American Community Survey • Poverty rates have increased in both counties but poverty rates are fairly low • Nassau County up from 4.4 percent in 2007 to 6.6 percent in 2012 • Change between 2011 and 2012 not statistically significant • Suffolk County up from 5.0 percent in 2007 to 6.9 percent in in 2012 • Change between 2011 and 2012 not statistically significant • While the populations of the two counties have grown about 3 percent since 2007, the number of people in poverty has grown much faster • The number of people in poverty grew by almost 50 percent, from 128,000 to 190,000 (56 percent in Nassau, 43 percent in Suffolk) • The number of people between 100 percent and 200 percent of the poverty level grew by 35 percent from 234,000 to 316,000 (19 percent in Nassau, 50 percent in Suffolk) • Number of people below 50 percent of poverty grew by 50 percent from 56,000 to 83,000 (65% in Nassau, 40% in Suffolk)
New poor? • Difficult to answer – most surveys are snapshots • Only Survey of Income and Program Participation looks at poverty status over time. • Most poverty spells are short • Some poverty is chronic or persistent • Sample not large enough to look at Suffolk County.
Official Poverty Measure Thresholds Resources • Cost of a minimum food basket times three • Multiplier based on 1955 consumption survey • Updated each year with the CPI • Same for all areas in the US • Gross (before-tax) cash income from all sources • Unit of analysis is the family (those related by birth, marriage or adoption) and unrelated individuals
Criticisms of Official Poverty Measure • Does not distinguish between needs of workers and nonworkers • Child care • Other work expenses • Does not reflect government policy initiatives • In-kind benefits – SNAP/WIC/LIHEAP • Tax credits • Tax policy • Irregular family size adjustments • Does not reflect increases in standard of living since 1955 • Does not reflect new family structures: resources of unmarried partners • Does not recognize variations in medical care costs and housing costs • Does not reflect geographic price variations
Supplemental Poverty Measure (SPM) Observations from the Interagency Technical Working Group - March 2, 2010 Will not replace the official poverty measure Will not be used for resource allocation or program eligibility Census Bureau and BLS responsible for improving and updating the measure Continued research and improvement Based on NAS panel 1995 recommendations Source: U.S. Census Bureau, Current Population Survey, 2012 Annual Social and Economic Supplement. http://www.census.gov/hhes/povmeas/methodology/supplemental/research/ Short_ResearchSPM2011.pdf 20
Comparison of SPM and Official Poverty Estimates: 2011 Official* Percent SPM *Includes unrelated individuals under age 15. Source: U.S. Census Bureau, Current Population Survey, 2012 Annual Social and Economic Supplement. 21
Comparison of SPM and Official Poverty Estimates: 2011 Official* Percent SPM *Includes unrelated individuals under age 15. Source: U.S. Census Bureau, Current Population Survey, 2012 Annual Social and Economic Supplement. 21
Comparison the Distribution of People: Total Population, SPM and Official Poverty Populations: 2011 t *Includes unrelated individuals under age 15. Source: U.S. Census Bureau, Current Population Survey, 2012 Annual Social and Economic Supplement. 21
Comparing the Official and SPM Thresholds and Units Official Measure Supplemental Measure • Cost of a minimum food basket times three • Updated each year with the CPI • Same for all areas in the US • Unit of analysis is the family (those related by birth, marriage or adoption) and unrelated individuals • 33rd percentile of sum of expenditures for food, clothing, and shelter, and utilities (FCSU) plus “a little bit more” • Updated each year with most recent 5 years of data • Adjusted for differences in home ownership status and geography • Unit of analysis expanded to include cohabiting partners and their relatives, unrelated children under 15, foster children under 22.
Income/Resource Definition Official Supplemental Gross money income PLUS value of near-money federal in-kind benefits for FCSU SNAP, school lunch, WIC Housing subsidies LIHEAP Tax credits (EITC) MINUS federal and state income and payroll taxes and other nondiscretionary expenses Child care and other work expenses Medical out of pocket expenses Child support paid • Gross (before-tax) cash income from all sources
Difference in SPM Rate After Including Each Element: 2011 Percentage point change in SPM rate after including each element Unemployment Insurance Source: U.S. Census Bureau, Current Population Survey, 2012 Annual Social and Economic Supplement. http://www.census.gov/hhes/povmeas/methodology/supplemental/research/ Short_ResearchSPM2011.pdf 22
Difference in SPM Rate After Including Each Element: 2011 Percentage point change in SPM rate after including each element Unemployment Insurance Source: U.S. Census Bureau, Current Population Survey, 2012 Annual Social and Economic Supplement. http://www.census.gov/hhes/povmeas/methodology/supplemental/research/ Short_ResearchSPM2011.pdf 22
Difference in SPM Rate After Including Each Element: 2011 Percentage point change in SPM rate after including each element Unemployment Insurance Source: U.S. Census Bureau, Current Population Survey, 2012 Annual Social and Economic Supplement. http://www.census.gov/hhes/povmeas/methodology/supplemental/research/ Short_ResearchSPM2011.pdf 22
Difference in SPM Rate After Including Each Element: 2011 Percentage point change in SPM rate after including each element Unemployment Insurance Source: U.S. Census Bureau, Current Population Survey, 2012 Annual Social and Economic Supplement. http://www.census.gov/hhes/povmeas/methodology/supplemental/research/ Short_ResearchSPM2011.pdf 22
Difference in SPM Rate After Including Each Element: 2011 Percentage point change in SPM rate after including each element Unemployment Insurance Source: U.S. Census Bureau, Current Population Survey, 2012 Annual Social and Economic Supplement. http://www.census.gov/hhes/povmeas/methodology/supplemental/research/ Short_ResearchSPM2011.pdf 22
Contact Information Trudi Renwick trudi.j.renwick@census.gov 301-763-5133