Download
1 / 16
160 likes | 293 Vues
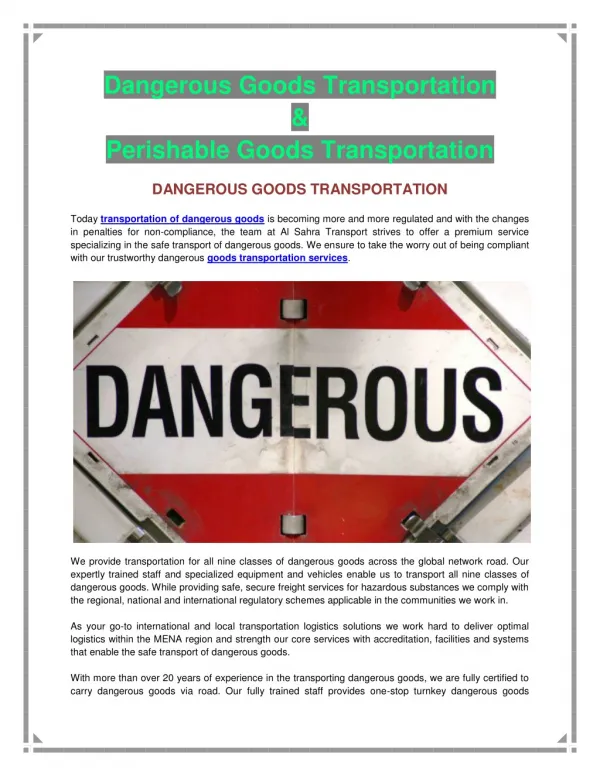
Quality Analysis in a Survey on Transportation of Goods by Road. Juris Breidaks University of Latvia Central Statistical Bureau of Latvia. Survey on Transport of Goods by Road. Started in January 1997

E N D
Quality Analysis in a Survey on Transportation of Goods by Road Juris BreidaksUniversity of LatviaCentral Statistical Bureau of Latvia
Survey on Transport of Goods by Road • Started in January 1997 • Target population - transport vehicles currently registered in Latvia and undergone technical inspection (approximate size - 50 000) • Sample unit - transport vehicle • Simple random stratified sampling • Continuous survey • Respondent - owner or renter of vehicle • Questionnaires mailed to respondents by post • Weekly sample size - 120 vehicles
The task of research • Starting from 2005 stratification has been changed • Planned aims to reach by change of stratification • To reduce the bias of estimates • To reduce the sampling error of estimates • The task of my research – evaluation of changes in the survey accuracy • Estimation of changes in sampling error • Estimation of changes in mean square error (MSE)
Bias of estimates • Two types of vehicles • nonresponce • mean of variables • This two differences lead the bias • Only this bias is studied in this paper
Main variables of the survey • Tonnes transported (TONN) • Tonne-kilometres performed for total goods road transport (TKM) • Kilometres travelled loaded for total goods road transport (KML2) • Tonnes transported for national goods road transport (TO_N) • Tonne-kilometres performed for national goods road transport (TK_N) • Kilometres travelled loaded for total national road transport (KM_N)
Task 1 • The estimation of the sampling error • The sampling error is estimated • for data of 2004 using stratification 2004 • for data of 2005 using stratification 2005 • The sampling error is estimated • for data of 2005 using stratification 2004 • for data of 2005 using stratification 2005
The coefficients of variation for estimates of variables in year 2004 and 2005
The estimation of the sample error with different stratification The standard deviation of g-th stratum Estimate of
The estimation of the sample error with different stratification Variance of is Estimate of is
The coefficients of variation of estimates of variables in 2005 using two stratifications
Task 2 • The estimation of the MSE • The MSE is estimated • for data of 2005 using stratification 2004 • for data of 2005 using stratification 2005 • The Bias is estimated • the estimated relative bias for data 2003 is used for stratification 2004 • the bias does not exist for stratification 2005
Conclusion • Comparing MSE of all variables, it became obvious that stratification from 2005 is better than previous stratification • The sample error is improved for all indicator, expect sample error of one indicator is worsen