Download
1 / 24
240 likes | 392 Vues
Trends in the Political Ideology of the Cuban-American Voter. Evidence from the Cuba Poll 1991-2011. Social Dimensions of Change in Cuban Miami. Institutions. population. culture. Social organization. Demographic Changes. Ideologies Norms Values Beliefs. Groups Classes

E N D
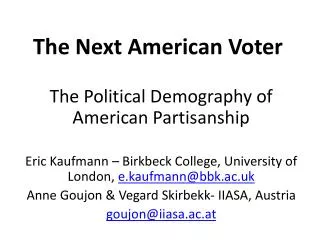
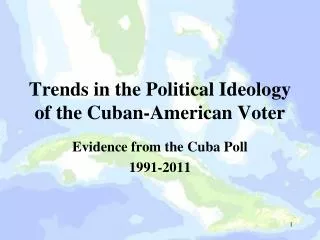
Trends in the Political Ideology of the Cuban-American Voter Evidence from the Cuba Poll 1991-2011
Social Dimensions of Change in Cuban Miami Institutions population culture Social organization Demographic Changes • Ideologies • Norms • Values • Beliefs • Groups • Classes • Stratification • Politics • Religious • Kinship • Education • Economy
Next Few Minutes… • Trends in Cuban Migration, Residency and Naturalization. • How these trends have shaped Miami’s Latino demographics. • How these trends have shaped Cuban political ideology on US/Cuba relations. • Final note on Cuban-American political exceptionalism. • You should walk away with a sense of the changing nature of Cuban voter opinion towards US/Cuba Relations and the forces that are ineluctably creating the changes.
Cubans Naturalized2003-2012 2003 2004 2005 2006 2007 2008 2009 2010 2011 2012
Comparative Rates of Naturalization of Selected Latino Groups2003-2012 2003 2004 2005 2006 2007 2008 2009 2010 2011 2012
Latino Origin PopulationPercent of Total Population (2% or more) 2010
Non-Hispanic African descent 425,650 17% Haitian 120,000 AA Cuban 860,000 35% Miami 2,496,435 Other Hispanic 31% Car 150,000 CA 212,542 <1994 559,00 65% >1994 301,00035% 1994> Other 142,000 SA 273,542 “Anglo” 383,551 15%
1990 Polls vs 2000 PollsAverage of ResponsesSupport for Embargo and Support for Dialogue
Do you think that the United States should continue the trade embargo with Cuba or should the United States end the trade embargo and permit normal trade with Cuba? Source: WPO 2009
1990 Polls vs 2000 PollsAverage of ResponsesSupport for Selling Medicines and Unrestricted Travel
Should unrestricted travel from U.S. to Cuba be allowed (for all Americans)?
Should unrestricted travel by all Americans to Cuba be allowed or not?
Do you favor or oppose the U.S. re-establishing diplomatic relations with Cuba?
Among Multiple Identities- What is The Primary Identification among Latino Sub-Groups Statistically significant @.055
LATINO GROUP PERCEPTIONS OF SOCIO-ECONOMIC COMMONALITIES Thinking about issues like job opportunities, education or income, how much do your ethnic subgroup have in common with other Latinos or Hispanics? Would you say [ethnic subgroup] share a lot in common, some things in common, little in common, or nothing in common with other Latinos? NOT STATISTICALLY SIGNIFICANT
LATINO GROUP PERCEPTIONS OF POLITICAL COMMONALITIES Now thinking about things like government services and employment, political power and representation, how much do [ethnic subgroup] have in common with other Hispanics or Latinos? Would you say [ethnic subgroup] share a lot in common, some things in common, little in common, or nothing in common with other Statistically significant @<.05