Download
1 / 54
550 likes | 695 Vues
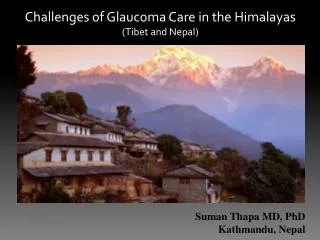
Challenges of Glaucoma Care in the Himalayas (Tibet and Nepal). Suman Thapa MD, PhD Kathmandu, Nepal. Worldwide problem. Glaucoma S econd leading cause of blindness after cataract ( Resnikoff , WHO 2002) Leading cause of irreversible blindness. Blindness from Glaucoma.

E N D
Challenges of Glaucoma Care in the Himalayas(Tibet and Nepal) Suman Thapa MD, PhD Kathmandu, Nepal
Worldwide problem Glaucoma Second leading cause of blindness after cataract (Resnikoff, WHO 2002) Leading cause of irreversible blindness
Blindness from Glaucoma • In 2010, it is estimated that glaucoma will affect approximately 60.5 million (Quigley, 2006) • 59 % will be women • 47% will be Asian • Primary open-angle glaucoma → 44.7 million • 55% will be women • 4.5 million will be bilateral blind (about 10%) • Primary angle closure glaucoma → 15.7 million • 70% will be women • 87% will be Asian • 3.9 million will be bilateral blind (about 25%) • Regarding angle closure glaucoma • More devastating and blinding disease → 3x more than POAG (Foster, BJO 2001) • Able to treat the pathophysiological mechanism if detected earlier
TIBET Blindness and eye diseases in Tibet • 15 900 people enumerated (response rate of 79.6%) • Adjusted Prevalence of Blindness • (presenting better eye VA < 6/60) 1.4% • Glaucoma (2.5%). • Cataract (50.7%), • Macular degeneration (12.7%) • Corneal opacity (9.7%). S Dunzhu et al. Br J Ophthalmol 2003
NEPAL • Between China and India • Population : 26.6 Million (2011) • Area: 147,181 sq. km • Health Budget: Aprox. 7 % of the total budget • GDP $450
Causes of Blindness: Population based studies Comparison 1981 and 2010
EYE CARE INFRASTRUCTURE IN NEPAL Eye Hospital = 21 Eye Department = 17 Community Eye Centre = 63 Krishna Gopal Shrestha
Understanding the burden of Glaucoma Hospital Based Data (2011) Results from a Population Based Study (2010) • Clinical Information from these data and the Implications • Challenges & Strategies adopted
Glaucoma Diagnoses ( 1 year) 2011Hospital Based Data PACG = POAG
DATA from Tilganga Institute of Ophthalmology, Kathmandu (2011) 79 % PACG were asymptomatic; Sec Glaucoma: NVG
Population Studies for Blindness • Designed specifically to estimate the causes of avoidable blindness: (Cataract, Trachoma, Vitamin A def, Trauma) • The NBS 1981 / RAAB 2010 estimated that glaucoma accounted for 3.8 % & 5.0 % of the total blindness (underestimation, design)
Bhaktapur Glaucoma Study, Nepal (2007-2010) Population based cross sectional study ISGEO definitions for glaucoma Represents a district in Nepal
Results • Prevalence 1.8 % (95% CI = 1.68 – 1.92) • POAG (1.2 %) > PACG (0.4 %) • Age was a RF (2.4 % : 60-69 years; 10.3% : > 80 years) • No difference in gender • Myopia , HTN, DM were not RFs for POAG Thapa SS et al. Ophthalmology 2012
Prevalence of Glaucoma in South Asia ACES: Aravind Comprehensive Eye Survey APEDS: Andhra Pradesh Eye Disease Study CGS: Chennai Glaucoma Study BGS: Bhaktapur Glaucoma Study
ComparisonAge, Sex, IOP, CCT and vCDR M: Male, F: Female, IOP: Intraocular pressure, CCT: Central Corneal Thickness, VCDR: Vertical Cup Disc Ratio
Ocular Biometric Measures Different population based studies . Thapa SS et al. Optometry and Visual Science 2011
Demographics of Glaucoma Cases POAG: Primary- open angle glaucoma, PACG: Primary-angle closure glaucoma
Visual Acuity Distribution of Glaucoma Cases Low vision has been defined as a best corrected VA of less than 6/ 18 (20/60, 0.3), but not less than 3/60 (20/400, 0.05) in the better eye. Visual acuity was based on the eye with glaucoma in unilateral cases and on the better eye in bilateral cases.
Clinical Information & Implications
Normal IOP ≈ 13 mmHg 18 mmHg should be considered on the higher side • Normal v CDR 0.2 0.7 should be viewed with suspicion • CCT influences the measurement of IOP
85.7 % had IOP within the normal range • 79 % had visual field defects at the time of diagnosis • 96 % had not previously been diagnosed • Angle closure glaucoma > 70 % asymptomatic • > 90 % were not aware of Glaucoma
Glaucoma 5.2% total blindness ( > the estimate of 1981 NBS: 3.8 % ) • Visual morbidity PACG > POAG (3 X )
Prevalence of Glaucoma in Bhaktapur district Represents primarily a ‘ Newari ’ ethnic raceAlthough the ‘ Newari ’ race constitute a large proportion of the countries population, the results from the BGS does not represent the epidemiology of glaucoma in Nepal
Separate screening programs for glaucoma are not necessary in Bhaktapur Target population > 60 years, ‘Opportunistic screening ‘ cataract screening programs • Optic discs have to be examined (0.7 VCDR) • Short axial lengths noted during Biometry for cataract surgery, should undergo gonioscopy • Measuring IOP has a limited role . Thapa SS et al. BMC Ophthalmology 2008
PACG • Majority ( 70% ) were asymptomatic (HBS , BGS) Gonioscopy has to be performed for correct diagnosis • High Risk Patients (HBS, BGS) Females > 50 years, short axial lengths • Severe visual impairment at presentation (HBS) ( >> POAG)
Role of the lens / formation of cataract in the pathogenesis of PACG has to be considered (BGS) • Early cataract removal may prevent progression to / of PACG in high risk patients
Challenges and Strategies Adopted
Burden of Blindness from Glaucomain Nepal • 88,800 Nepalese 30 years and older have definite glaucoma • Three times more = glaucoma suspects • Almost 400,000 Nepalese have definite or probable glaucoma 2010 Nepal Mid Term Report, Vision 2020
Challenges • Aging Population • Geographic terrain • Limited Human Resource • Poverty, Illiteracy • Glaucoma, the disease
Training Programs for Glaucoma Ophthalmologist • ResidencyProgram (1994): University Hospital • Short - term observer training (2005) – 1 month • Glaucoma Fellowship (2013) – 1 year
Ophthalmic Assistant Training Program (2001) • 3 years • ( ? additional glaucoma training) OA Glaucoma Training Program (2004) • 20 OAs from several community eye centers affiliated to secondary eye hospitals • 5 days training, Tertiary Eye Centre • Glaucoma diagnosis, IOP measurement, Optic disc photos, VFs
Objective • Detect glaucoma & refer patients to the secondary eye hospitals FAILED • Training duration : short • Problems in monitoring the outcome after the training Redesigning the training program To start with OAs working in CECs belonging to our institute Longer duration of training
Screening Large Population Screening • Costs , Infrastructure • Tools for screening Case Detection / Opportunistic Screening
Opportunistic screening in 1 day cataract screening clinics in the villages(2006)
Treatment • Beta blockers: 1st line of treatment • Additional drugs: Issues regarding costs • Primary Surgery Ask patients about affordability
Glaucoma Education & Awareness Programs(2003) • Glaucoma Support Group Activities - 6 education classes / year • Annual Glaucoma Awareness Week - Free investigations and treatment - Information Booklets
Impact of GSG and Awareness Programs(2004- 2011) Total number of patients examined during Glaucoma Awareness Week Number of participants during patient education programs Financial support extended by patients attending support group classes towards the treatment of patients
Research Nepal Angle Closure Glaucoma Study (NACGS, 2012 -2015) • 3 year Prospective, Surgical Trial • To evaluate the outcomes of Cataract removal vs. Trabeculectomy or Combined surgery in the treatment of ACG Bhaktapur Retinal Study(BRS, 2013- 2017) • Diabetic Rp, AMD, Venous occlusions • 5 year Follow Up of BGS patients (Longitudinal / Prospective • Cohort)
Conclusion What we know • Glaucoma blindness will increase with aging population • PACG causes more visual morbidity than POAG What we should focus on • Case Detection & Opportunistic Screening • Treatment, economics
Raising awareness on glaucoma • Training Human Resource • Research What we hope to expect • Cataract intervention programs : Can it help prevent ACG at its early stage and prevent ACG blindness?
Tertiary Level Glaucoma Specialists General Ophthalmologists Sub-specialty Service (programs) 11 CECs OAs 1 Secondary Level Hospital General Ophthalmologist 2 CEC OAs Validate OA Training Programs Case detect at community level Promote Awareness
2003 • One of the first with a Fellowship in Glaucoma in Nepal • Glaucoma Fellowship at RVEEH, Melbourne • Prof Hugh Taylor • Trained under 6 glaucoma specialists in one institution
Raising awareness on glaucoma • Training Human Resource • Research What we hope to expect • Cataract intervention programs Could it help prevent ACG at its early stage and prevent ACG blindness?
Achievement Gap of Human Resource
? ? Glaucoma Blindness 7.1 % (2007) ? ? POAG – 2.5% PACG – 0.4% (Foster, 1996) POAG – 2.3% PACG – 0.5 % (Casson, 2009) POAG – 2.0% PACG – 2.5% (Casson, 2007) POAG –1.2 % PACG – 0.4 % (Thapa, 2010) South Asia
Females, > 60 years of age, short axial lengths could develop PACG • LPI, Early cataract extraction can be considered in high risk patients
POAG – 1.62% PACG – 1.08% (Dandona, 2000) POAG – 1.62% PACG – 0.9 % (Vijaya, 2005/6) POAG – 0.41% PACG – 4.62% (Jacob, 1998) POAG – 1.7% PACG – 0.5% (Ramakrishnan, 2003) India