Extreme Events
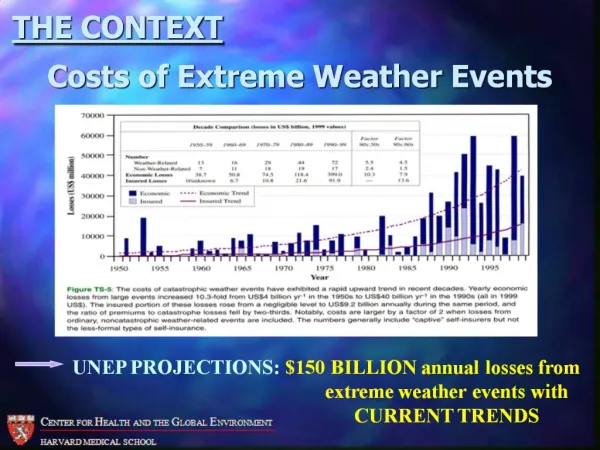
Extreme Events. John Kollar, ISO May 19, 2003. Estimated Insured Losses (9/11/01). $ 25-45 billion 18-24 billion of Property (including B.I.) 1-2 billion of Workers Compensation 3-10 billion of General Liability 2-5 billion of Aviation 1-3 billion of all other. Extreme Events.


Extreme Events
E N D
Presentation Transcript
Extreme Events John Kollar, ISO May 19, 2003
Estimated Insured Losses (9/11/01) • $25-45 billion • 18-24 billion of Property (including B.I.) • 1-2 billion of Workers Compensation • 3-10 billion of General Liability • 2-5 billion of Aviation • 1-3 billion of all other
Extreme Events • Unexpected • Unusually large • Sudden • Large (insured) losses • Multi-line (clash losses) • Extreme Event Theory (Tom) • AAA Extreme Event Risk Committee • Terrorism focus • Non-terrorism (cyber risk, Northeast hurricane, Tokyo earthquake)
Underwriting Risk Considerations • Quantify the underwriting risk (needed capital), taking into account: • Loss volatility • Correlation between lines (dependencies) • Adverse loss development for long-tailed lines
Loss Volatility Requires More Capital } More Capital Insurer A Insurer B Less Capital } Expected costs
The Effect of Correlation Capital Capital High Risk Low Risk Low Risk High Risk Total Total Low Correlation High Correlation Insurer A Insurer B
Short vs Long-Tailed Lines Long-Tailed Lines Release a portion of capital at the end of each year. Short-Tailed Lines Release most capital at the end of 1st year. Year 1 Year 2 Year 3 Year 4 Y1 Y2 Y3 Y4
Extreme Event Analysis • Analyzed 19 insurers individually. • Calculated aggregate loss distributions using information by annual statement lines of business • By insurer • Total for the “industry” of 19 insurers • Net of reinsurance • Used exposure reported to ISO as input into AIR’s CLASIC/2 catastrophe model for hurricanes and earthquakes • Generated 10,000 years for hurricane, earthquake and all other losses. • Correlations between lines and insurers are driven by uncertainty in claim frequencies and claim severities. • Compare the losses for each of the 10,000 years to insurer capital.
Extreme Events = Worst 500 Years • “Industry” defined as sum of the 19 insurers. • Selected the worst (highest losses) 500 (5%) “industry” years. • Graphs on spreadsheet show results. • Results show that catastrophes drove losses for 8 of the worst years (net of reinsurance). • However most of the top 500 did not involve catastrophes (net of reinsurance).