Directories and Dashboards
70 likes | 201 Vues
Join presenters Jeff Jones and Brandon Tilley from Fresno Pacific University as they delve into effective strategies for managing directories and dashboards. In this session from October 11, 2010, learn about campus-wide photo management, HTML and CSS formatting, and utilizing Google Maps and mailto syntax for enhanced user experience. Discover the evolution of dashboarding techniques, including live data extraction and visualization using free Flash charts and Google Web Toolkit, and gain insights on leveraging modern technologies for reporting.

Directories and Dashboards
E N D
Presentation Transcript
Directories and Dashboards PRESENTER: Jeff Jones & Brandon Tilley | Fresno Pacific University | October 11, 2010
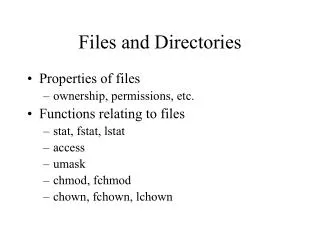
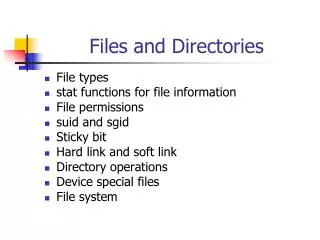
Directories • No Campus wide-photo repository • We have the photos, only used for ID cards • President had a need…
Image syntax: • <imgsrc="url" alt="some_text"/> • Link syntax: • <a href="url">Link text</a> • Map syntax: • http://maps.google.com/maps?f=q&hl=en&q=ADDRESS,+CITY,+ST,+ZIP • Mailto syntax: • <a href="mailto:some_email@school.edu">Email</a>
CSS formatting • http://www.w3schools.com/css/css_font.asp • HTML syntax • http://www.w3schools.com/html/html_links.asp • http://www.w3schools.com/html/html_images.asp • Mailto syntax • http://www.ianr.unl.edu/internet/mailto.html
Dashboarding the 3.2.x way • Live Excel • Extract data to memory • Used free Flash charts to display data visually • http://github.com/FPU/icon2010
Dashboarding the 4.x way • Got the RMI working from the SDK • Pulled the appropriate reports • Displayed the reports using Google Web Toolkit • http://github.com/FPU/icon2010