Download
1 / 40
410 likes | 643 Vues
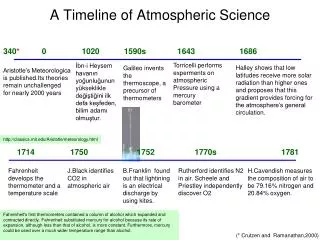
History of Atmospheric Science Development of meteorological instruments. Course Outline. Date Topic 1 11/03/2011 Introduction / Organisation 2 11/10/2011 Aristotle’s Meteorology – atmospheric science 350 B.C 3 11/17/2011 The Weight of Air – Galilei, Torricelli, Boyle

E N D
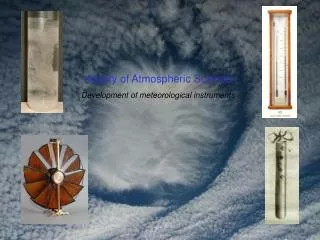
History of Atmospheric Science Development of meteorological instruments
Course Outline Date Topic 1 11/03/2011 Introduction / Organisation 2 11/10/2011 Aristotle’s Meteorology – atmospheric science 350 B.C 3 11/17/2011 The Weight of Air – Galilei, Torricelli, Boyle 4 11/24/2011 Discovery of Oxygen 5 12/08/2011 Atmospheric Dynamics and the Coriolis Effect 6 12/15/2011 The classification of Clouds – Luke Howard’s heritage 7 12/22/2011 Discovery of the Greenhouse Effect 8 01/12/2012 Instrumentation I – Meteorological Instruments 9 01/19/2012 Instrumentation II – Optical and Spectroscopic instruments 10 01/26/2012 Discovery of Ozone, Ozone Crisis and Ozone Hole 1102/02/2012 Discovery of the Magnetosphere 12 02/09/2012 The Gaia-Hypothesis – a critical Review 13 02/16/2012 Summary
Summary of last lecture • Current understanding of the greenhouse effect • Joseph Black’s contribution • John Tyndall’s work • Arrhenius and his famous paper: • “On the Influence of Carbonic acid in the Air upon the Temperature of the Ground” • Current understanding of the global carbon cycle
Lecture Outline • Thermometers • Barometers • Anemometers
Thermoscope or thermometer ? • Thermoscope: Thermometer without a scale • It cannot be used to measure temperature differences quantitatively, but only qualitatively • Thermometer: Has a scale and allows to measure temperatures and temperature differences quantitatively
Italian (left) and Dutch (right) versions of the thermometer/thermoscope Leurechon‘s „Recreation mathematique“ (1626) Giambattista della Porta (1538-1615) „I tre libri de spiritali“ (published 1606) Galilei’s thermoscope • Galileo Galilei is usually credited to be the inventor of the thermometer, the „Galilei thermometer“ or „Galilei thermoscope“ • It was probably developed in 1593 in Padua • Measurement principle: Air thermometer • An inverted glass tube partially filled with water is immersed in a water basin. When heated the air expands, the water level falls, and vice versa. • Problem: This simple air thermometer also responds to pressure changes • Note: Galilei‘s instrument was not a thermometer, but a thermoscope
Santorio’s thermometer • The italian Santorio Santorio (1561 – 1636) was presumably the first one to use a scale in combination with a thermoscope in 1612 • Santorio‘s thermometer also used air as a medium • Santorio writes in "Commentaria in artem medicinalem Galeni", (in the 2nd edition 1630 (1st edition 1612)): • „We determine here the temperature with our glass instrument and determine the highest and lowest points in the following way. We immerse the bulb of our instrument in snow, which forces the water to rise to its hightest point. Then we heat the bulb with the flame of a candle, and the water goes down to its lowest point. If we determine the extremes like that, it will be an easy task to determine intermediate values, and to find out how much each object deviates from it.“ • Similar thermoscopes were developed independently in the Netherlands by Cornelius Drebbel (1572 – 1643) and in England by Robert Fludd (1574 – 1637)
Giambattista della Porta (1538-1615) "I tre libri de spiritali“ (published 1606) Open air-thermoscopes/thermometers • All instruments described so far were open air-thermoscopes/thermometers • Open: The liquid (water or spirit of wine) reservoir was directely connected to the atmosphere and the system was not closed • The water level was affected by changes in air pressure • The first closed thermoscope/thermometer was probably made by grand duke Ferdinand II of Tuscany (1628 – 1670) around 1641. • Expansion of the liquid was then exploited, not the expansion of the enclosed air volume
The other “Galilei thermometer” or the sphere thermometer • There is no proof that Galilei in fact invented this thermometer • This type of thermometer was first reported by Torricelli to Balthasar de Monconys (1611 – 1665): • „… that the grand duke (Ferdinand II of Tuscany) owns several thermometers to tell the cold and the warmth, all of which are filled with the spirits of wine, and which contain spheres filled with air. One of these contains two spheres, one of which is at the top and the other one at the bottom. When becoming warmer the lower one rises, when becoming colder the upper one sinks down.“ • Working principle: • The spheres are hollow and have different mass. The temperature dependent density of the liquid causes the vertical motion of the spheres
Fahrenheit’s mercury thermometer • Gabriel Fahrenheit (1686 – 1736) developed the first mercury thermometer in 1714, which provided higher accuracy than the previously developed instruments • Advantages of Mercury: • a) Temperatures from well below the freezing point to well above the boiling point of H2O or alcohol can be measured (Melting point: -38.83° C; Boiling point: 356.73° C) • b) Furthermore, mercury expands and contracts more uniformly than the other liquids in use at that time
Early Development of temperature scales • 1665 Robert Hooke first used the freezing point of H2O as a fix point of a temperature scale • 1665 Christian Huygens proposed the use of either the freezing or the boiling point of H2O as fix points (the latter one can be realized globally in all seasons) • 1679 Sebastiano Bartolo (1635 – 1679) first proposed the use of 2 fix points (freezing and boiling point of H2O) • Note: • The temperature of deep cellars was also discussed extensively as a lower fix point of the temperature scale (based on temperature measurements in the cellar laboratories of the French Academie of Sciences in Paris), because it remains more or less constant throughout the year
Subscales 9 degrees of heat (Hasler) Geographic latitude Heat scale by Galen (129 – 199) Historic temperature scales (Hasler 1578) • Hasler „De logista Medica“ (1578): • Also deals with the question: • „How can we find the natural warmth of a human depending on age, season, latitude and other influences.“ • Body temperatures of humans living at low latitudes were belived to be higher than for inhabitants of higher latitudes
Further development of temperature scales • 1700 Temperature scale by Isaac Newton • 1701 Temperature scale by Ole Rømer • 1724 Temperature scale by Gabriel Fahrenheit • 1731 Temperature scale by René Réaumur • 1732 Temperature scale by Joseph-Nicolas Delisle • 1742 Temperature scale by Anders Celsius • 1743 Temperature scale by Jean Pierre Cristin • 1848 Absolute temperature scale by Lord Kelvin • 1859 Absolute temperature scale by William Rankine
Newton’s temperature scale • Isaac Newton developed his temperature scale around 1700 • Measurement medium: linseed oil • If heated from the temperature of melting snow to the boiling point of H2O it expands by about 7% • Scale: Zeroth degree of heat: Temperature of melting snow • 33 degrees of heat: Temperature of boiling water • Precurser of the Celsius scale • The Newton degree corresponds to 100/33 of a degree Celsius • Prior to the development of this quantitative scale Newton has also proposed a qualitative scale comprising about 20 degrees between "cold air in winter" to "glowing coals in the kitchen fire".
Rømer’s temperature scale • The Danish astonomer Ole Rømer proposed his temperature scale in 1701 • Fix points: • 0° temperature of freezing brine • 60° temperature of boiling water • Rømer realized that the freezing point of H2O corresponded to about 7.5° of his scale, so he used this value as an additional fix point. • 1°Rø degree corresponds to 40/21 Kelvin
The Fahrenheit temperature scale • The German scientist Gabriel Fahrenheit (1686 – 1736) proposed his scale in 1724 • The Fahrenheit scale employs the freezing and boiling points of H2O as fix points • The temperature difference between these fix points is divided into 180 degrees • 32 was chosen as the temperature value at the lower fix point. This ensures that the temperature did not become negative for the lowest temperatures Fahrenheit was able to produce in the lab • Note: The claim, that the upper fix point of the Fahrenheit scale corresponds to the normal temperature of human blood (or that of a healthy cow) is incorrect.
The Réaumur scale • The Réaumur scale also employs the freezing and boiling points of H2O as fix points with the freezing point corresponding 0° and the boiling point to 80° Réaumur • Rene Antoine Ferchault de Réaumur (1683 – 1757) introduced his scale in 1731 • The Réaumur scale is not used nowadays (except for measuring the temperature of milk used for making cheese) • Another explanation of the Réaumur scale: • - The freezing point of water was used to define 0° Ré • - A scale was then applied to the tube such that each degree corresponds to 1/1000 of the volume of the bulb and tube (up to the zero mark) combined. • - Because of the specific expansion coefficient of the type of alcohol used as a medium, the boiling point of H2O corresponded to 80° Ré
The Delisle temperature scale • The french scientist Joseph-Nicolas Delisle (1688–1768) introduced his temperature scale in 1732 • The temperature of boiling water was used as a fix point (0° De) • The original Delisle scale had 2400 graduations each corresponding to a contraction of the Hg sample by 1/100000 • In 1738 Josias Weitbrecht (1702 – 1747) slightly recalibrated the Delisle thermometer so that 0° De corresponded to the boiling point, and 150° De to the freezing point of H2O. • The initial Delisle scale relied only on one fix point, similar to the Réaumur scale • The Delisle thermometer was used in Russia for nearly a century until the early 19th century
Celsius scale • Anders Celsius (1701 – 1744) introduced a temperature scale in 1742 dividing the range between the freezing and boiling points of H2O into 100° • 0° corresponded to the boiling point of H2O and 100° to the freezing point • In 1743 the French scientist Jean Pierre Cristin (1683 – 1755) inverted Celsius‘ temperature scale such that: • freezing point 0° and boiling point 100° • In 1948 Cristin’s inverted scale was termed Celsius scale by an international agreement • Miscellaneous note: - 40° C ≙ - 40° F
The Kelvin scale • In 1848 Sir William Thompson, also known as Lord Kelvin (1824 – 1907) introduced the absolute temperature scale • The temperature difference of 1 K(elvin) corresponds to 1° C • 0 K is the lowest possible temperature • K is the Standard Unit of temperature
Rankine’s scale • The Rankine scale is an absolute temperature scale proposed by the Scottish scientist William Rankin in 1859 • 0 Rankine = 0 R equals absolute zero • A temperature difference of 1 Rankine corresponds to a difference of 1° Fahrenheit, not to 1°C, which is the case for the Kelvin scale • 0 R corresponds to -459.67 °F • The Rankine temperature scale is still used in some engineering disciplines as a thermodynamic temperature scale
Conversion formulas • Example: • 20 °C = 68 °F • = 293.15 K • = 527.67 °R • = 120 °De • = 6.6 °N • = 16 °Ré • = 18 °Rø
Torricelli barometer • Evangelista Torricelli invented the Hg barometer in 1643 or 1644 • The open Hg reservoir made transport of barometers problematic • Use of porous leather reservoirs • Robert Boyle introduced the U-shaped Hg-tube • Rene Descartes adds a paper scale to the Hg barometer • 1 Torr = 1 mmHg; standard pressure: 760 mmHg
Huygens or contra barometer • Christian Huygens solved one of the big problems of the Torricelli Hg-barometers: they were difficult to read • He added a second and thinner tube filled with a coloured liquid. The movement of the coloured liquid is multiplied (by 10), because of the smaller diameter of the second tube („Multiplicator“) • „Contra“: Due to the design a rising air pressure leads to a decrease in the Hg column
Fitzroy’s storm glass • Admiral Fitzroy (1805 – 1865) developed his storm glass or “Fitzroy barometer” • The storm glass contains a mixture of camphor, ammoniumchloride, alcohol, potassium nitrate and water, and is supposed to react to air pressure, temperature, wind direction, and the electrical charge of the air • He participated as captain of HMS Beagle in Charles Darwin’s expedition between 1834 and 1836 • In 1854 Fitzroy became the first director of the institution now known as the Met Office • Typical readings and the predicted weather: • Clear liquid Good, fine weather • Crystals at bottom Frost in winter • Turbid liquid (substance rising) Rain • Turbid liquid with crystals Thunder • Large crystals Close weather, cloudy skies, snow • Chains of crystals at the top Windy weather • Substance lies to one side Storm or wind from other direction • Bei nebenstehend abgebildeten Wetterstation einer niederländischen Firma befindet sich neben dem Contra-Barometer nach Huygens noch ein Thermometer und darüber ein sogenanntes Sturmglas nach Admiral Fitzroy • Admiral Fitzroy lebte im 19.Jahrhundert und war zu dieser Zeit als General zur See und als Meteorologe tätig. Er war ein Mitgründer des "British Meteorlogical Service" und machte einige Erfindungen im Bereich der Marinebarometer. Seine wohl berühmteste Erfindung wurde, um 1860, als das Victorian'sche Admiral Fitzroy Barometer bekannt. Es besteht aus einer Glasröhre mit einer gesättigten, farblosen, chemischen Mixtur aus Kampfer in Alkohol und anderen Chemikalien. Am Zustand der Kristalle läßt sich das kommende Wetter ablesen. Wetterveränderungen sollen sich durch ausflocken, Kristallisation und Ähnlichem, bemerkbar machen und einordnen lassen. Die entstehenden Kristalle sollen je nach Wetter unterschiedliche Gestalt und Größe annehmen. Das Gerät ist nur bedingt von Temperatur oder Luftdruck abhängig. Seefahrer glaubten, an Hand des Erscheinungsbildes der Kristalle, charakteristische Wetterlagen vorhersagen zu können. Admiral Fitzroy beschrieb, für einige Windrichtungen und Wetterveränderungen, Formen und Muster der Kristalle. (Beispiele solcher Kristalle eines Sturmgalses sind unten dargestellt, entnommen aus Wetterfronttube)
Johann Wolfgang von Goethe(1828 by Joseph Karl Stieler) Goethe’s barometer • Goethe may have owned one of these barometers, but he was almost certainly not its inventor • This barometer is also known as „weather glas“, „thunder glas“, „storm glas“ • It is a water-based barometer
The Eco-Celli barometer • The Eco-Celli-Barometer is a mercury-free barometer • As in case of the Goethe barometer an enclosed air volume compensates the air pressure • In order to correct for temperature effects a adjacent liquid thermometer is used (blue liquid) • If red level lower than blue level: High pressure, nice weather • If blue level lower than red level: Low pressure, rain and storm • If blue level similar to red level: variable weather
The aneroid barometer or Vidie barometer • Aneriod barometers (or „Vidie-barometers“ after Lucien Vidie (1805 – 1866)) consist of a (partially) evacuated deformable tin chamber, which is deformed by changes in atmospheric pressure • More sophisticated Vidie barometers use a linear arrangement of several „Vidie cans“ in order to improve sensitivity • The deformation is then mechanically transferred to an index pointer • One problem of aneroid barometers is their temperature sensitivity • Simple barometric height measurement devices are usually aneroid barometers
The plate anemometer by Leon Battista Alberti • The plate anemometer was first described by Leon Battista Alberti around 1450 and later also by Leonardo da Vinci (around 1500) • The instruments consist of a movable plate whose tilt was a measure for the wind speed • The plate anemometer was re-invented by Robert Hooke in 1668 • Disadvantage: The plate must always face the wind, i.e., has to be manually or mechanically adjusted
Barometric anemometers • The first barometric anemometer was presumably developed by Pierre Daniel Huet in 1721 (also known as Pitot‘s tube) • Barometric anemometers come in different varieties: Lind‘s tube Magius‘ tube • Disadvantage: The devices must be oriented relative to the wind
The cup anemometer • The astronomer Thomas Robinson is credited with the development of the cup anemometer in 1845, which is still in use nowadays • Robinson‘s original anemometer had 2 cups
The wing anemometer • Benjamin Biram patented in 1842 an anemometer with rotating wings and an mechanical display • The first of these anometers were manufactured by a Mr. Davis (Derby) in early 1845
The Beaufort scale I • Francis Beaufort (1774 – 1857) describes his first wind scale in his private log in 1806, when serving as captain of the HMS Woolwich: • In 1807 Beaufort combined categories 0 and 1 so that there were 13 categories • In 1807 he also added a description of the canvas (sails) to be carried by a frigate in different wind conditions: • - zero: all his sails would be up • - six: half of the sails would have been taken down • - twelve: all sails would be stowed away
The Beaufort scale II • In 1838 the British Admiralty released the following memorandum 1838 to “all Captains and Commanding Officers of Her Majesty's Ships and Vessels”. Admiralty, Dec 28th, 1838 M E M O R A N D U M THE Lords Commissioners of the Admiralty having had under consideration the general utility of recording with clearness and precision, in the Log Books of all Her Majesty's Ships and Vessels of War, the actual State of the Winds and Weather, have thought fit to order that henceforward in each page of the Log Book two columns should be introduced, wherein the force of the Wind and the appearance of the Atmosphere shall be every hour registered according to the annexed scheme, a copy of which shall be pasted into each book and painted on the back of every Log Board or Log Slate and two more columns shall likewise be given for the purpose of entering the heights of the Barometer or Sympiesometer, and Thermometer, when such instruments may be on board. By Command of their Lordships, C. WOOD
Evolution of the Beaufort scale • 1903 Introduction of a formula to relate the Beaufort-forces to windspeed: • v = 0.836 m/s B3/2 • 1944 Extension of the Beaufort scale up to Force 17, with the extra forces corresponding to special meteorological conditions, e.g., tropical cyclones • 1960 The Beaufort scale was further extended by including (typical and maximum) wave heights
Conclusions • Development of Thermometers • Historical temperature scales • Barometers • Anemometers • The Beaufort-scale