OPUS-Projects: Simplify Site Management & Data Processing
330 likes | 353 Vues
OPUS-Projects provides web-based tools for easy visualization, management, and processing of data across multiple sites and occupations. Features include enhanced data processing, seamless connectivity, and solution visualization aids.

OPUS-Projects: Simplify Site Management & Data Processing
E N D
Presentation Transcript
NGS OPUS-Projects Scott Lokken NGS NC Advisor
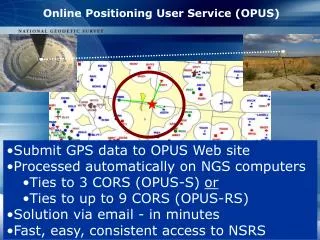
2 2011-02-25 What Is OPUS-Projects? • OPUS-Projects gives users web-based access to simple visualization, management and processing tools for multiple sites and multiple occupations. • These tools include: • The advantages of data uploading through OPUS. • Data visualization and management aids. • Enhanced data processing using the PAGES suite. • Solution visualization aids. • Seamless connectivity with other OPUS tools.
3 2011-02-25 What Is OPUS-Projects? Graphically, this looks like: Session Solution Session Solution Your OPUS Project Publish To OPUS Session Solution Session Solution OPUS Solution Data & Metadata Network Solution OPUS Solution Processor or Manager Manager OPUS Solution Copy To User Copy To User Copy To User
4 2011-02-25 (Note that the browser’s navigation banners at the top and bottom of each page are omitted.)
5 2011-02-25
6 2011-02-25
7 2011-02-25 The first step is to create a project. This allocates on-line storage for the project’s data and generates project keywords. Start by clicking the “Create” button.
10 2011-02-25 If you are registered, you can complete the form and click the (now enabled) Create button.
11 2011-02-25 After a moment, the introduction to your newly created project is displayed. You’ll also receive an email with this information.
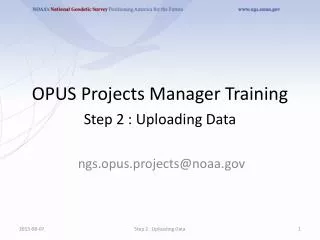
16 2011-02-25 Uploading Data to a project
17 2011-02-25 • The second step is to “Upload” data files to your project. • At this time, this is done through OPUS-S implying the same restrictions: • Your data must be dual frequency pseudorange and phase P1 (or C1), P2, L1 and L2. • A minimum 2-hours data span for each submission. • A collection rate of 1, 2, 3, 5, 10, 15 or 30 seconds.
18 2011-02-25
19 2011-02-25
20 2011-02-25
22 2011-02-25 The highlight is mine. These preferences can be modified by the project manager.
23 2011-02-25 View and Process A Session
24 2011-02-25
25 2011-02-25 The table below the map summarizes the status for each mark.
26 2011-02-25 The table below at the bottom of the page graphically represents the data availability.
27 2011-02-25
28 2011-02-25 Manage a project
29 2011-02-25
30 2011-02-25 The map shows the relative location of the project’s marks. Here, again, the Session solution results are shown, but the OPUS solution results could be selected and displayed instead.
31 2011-02-25 The summary table at the bottom of the page also provided convenience links to other pages for the project.
32 2011-02-25 Session solution matrices can be combined and solved creating an adjustment for this project.
33 2011-02-25 an Individual site page
34 2011-02-25
35 2011-02-25 At the top we see the title and controls.
36 2011-02-25 Next is a mockup of the datasheet if the mark were to be published. These can be edited by the manager if errors or omissions are found.
37 2011-02-25 Below the datasheet mockup is a summary of site metadata by occupation.
38 2011-02-25 Below the summary by occupation are the coordinate and status summary tables.
39 2011-02-25 And at the bottom are summary plots and tables for comparison of different solutions. The orange parts of the plots indicate regions outside the thresholds set by the project manager.