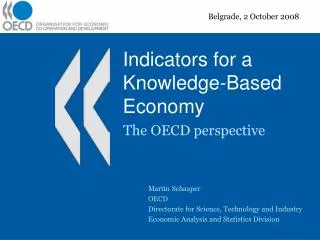
Indicators for a Knowledge-Based Economy
Belgrade, 2 October 2008. Indicators for a Knowledge-Based Economy. The OECD perspective. Martin Schaaper OECD Directorate for Science, Technology and Industry Economic Analysis and Statistics Division. Directorate for Science, Technology and Industry. EAS: how we work. Data. Analysis.

Indicators for a Knowledge-Based Economy
E N D
Presentation Transcript
Belgrade, 2 October 2008 Indicators for a Knowledge-Based Economy The OECD perspective Martin Schaaper OECD Directorate for Science, Technology and Industry Economic Analysis and Statistics Division
EAS: how we work Data Analysis Methodology
S&T: a linear model? The model Indicators
A systems approach Innovation is dynamic and complex: • Many actors, many linkages • Feedback and feed-forward loops innovation is non-linear
The Scoreboard: an integrated view C. Innovation policy A. R&D B. HRST D. Innovation performance F. Particular technologies E. ICT G. Internationalisation of S&T H. Global economic flows I. Productivity and trade
A. Research and Development • First edition published in 1963! • Sixth edition published in 2002 • Data also collected since 1963
Highlights of the 5th Frascati Manual revision • Improved methodological guidelines • Update various classifications • R&D in service sectors • Human resources for R&D • Survey methods business enterprise sector • GBAORD • Globalisation and links to SNA (capitalisation of R&D!) • Annexes on health, ICT and biotechnology
Definition of R&D • Research and experimental development (R&D) comprise creative work undertaken on a systematic basis in order to increase the stock of knowledge, including knowledge of man, culture and society, and the use of this stock of knowledge to devise new applications.
Exclusions from R&D • Education and training • Other science and technology activities • Other industrial activities • Administration and other supporting activities
Intramural R&D expenditure • By sector of performance (BES, HE, GOV, PNP) • By source of funds (same plus abroad) • By type of activity (BR, AR, ED) • By type of cost (current and capital) • By field of science (nat sc, eng & techn, med sc, agri sc, soc sc, hum) • By socio-economic objective (~ NABS)
Business Expenditure on R&D • BERD by industry (NACE/ISIC) • Main activity • Product field • ISIC 73 • BERD by size-class
Government Budget Appropriations or Outlays for R&D (GBAORD) • Exploration and exploitation of the earth • Environment • Exploration and exploitation of space • Transport, telecommunication and other infrastructures • Energy • Industrial production and technology • Health • Agriculture • Education • Culture, recreation religion and mass media • Political and social systems, structures and processes • General advancement of knowledge: GUF • General advancement of knowledge: non-GUF • Defence
R&D Personnel • In headcounts and full-time equivalents • By sector of employment • By occupation (researchers, technicians, oss) • By qualification (ISCED) • By field of science • By industry • By sex • By age-group
B. Human Resources for Science and Technology (HRST) • The Measurement of Human Resources Devoted to Science and Technology – Canberra Manual (1995) • The CM is part of the Frascati family • Careers of Doctorate Holders (CDH)
Dimensions of HRST • Skills • Qualifications • Mobility
Definition of HRST(Canberra Manual) HRST are people who fulfil one or other of the following conditions: a) successfully completed education at the third level in an S&T field of study; b) not formally qualified as above, but employed in a S&T occupation where the above qualifications are normally required.
Definition of HRST (cont.) Education • ISCED Level 5- First stage of tertiary education (not leading directly to an advanced research qualification) • ISCED 5A: theoretically based/research preparatory or giving access to professions with high skills requirements • ISCED 5B: practical/technical/occupationally specific • ISCED Level 6- Second stage of tertiary education (leading to an advanced research qualification)
Definition of HRST (cont.) Occupation • A subset of ISCO Major Group 1: Legislators, senior officials and managersUsually ignored! • ISCO Major Group 2: Professionals • ISCO Major Group 3: Technicians And Associate Professionals
NSE Fields of study • Natural sciences • Engineering and technology • Medical sciences • Agricultural sciences • Social sciences • Humanities • Other fields
International mobility of HRST • Definitions • Place of birth vs. citizenship • Measurement problems • Migration and qualification • Data often not comparable between countries • Migration outflows • Relevant for many non-OECD countries • Very little detailed information
Sources for HRST • Education databases • Labour force surveys • Population registers • Censuses • National administrative systems for regulating and monitoring immigration • Administrative systems relating to temporary residence or work permits for non-nationals • Specific surveys
Graduation rates at doctoral level, 2004 (% of relevant age cohort)
Tertiary-level graduates in total employment, 2004 (as a % of total)
Students from non-OECD economies enrolled in OECD countries, 2004
Careers of Doctorate Holders (CDH) • A joint OECD/Eurostat/UNESCO project launched by the OECD Secretariat in 2004 • An expert group of 40 countries among which the United States, Japan, China, India, Argentina, Uganda and many European countries • A three-component package developed by the expert group: output tabulations, methodological guidelines and a model survey questionnaire
Model questionnaire 7 MODULES • MODULE EDU - DOCTORAL EDUCATION • MODULE REC - RECENT GRADUATES • MODULE POS - POSTDOCS • MODULE EMP - EMPLOYMENT SITUATION • MODULE MOB - INTERNATIONAL MOBILITY • MODULE CAR - CAREER RELATED EXPERIENCE AND SCIENTIFIC PRODUCTIVITY • MODULE PER - PERSONAL CHARACTERISTICS
Methodological guidelines 1. Introduction 2. Purpose of statistics on CDH 3. The target population 4. Survey methodology 5. Collecting and processing of data 6. Estimation of results and data quality 7. Data transmission
CDH data collection • First collection in 2005 for 7 countries • Second collection launched mid-November 2007 • Data received for 22 countries: 20 European countries + Australia + US • Data for Canada, Croatia and Malta still pending; new version of Australian data based on the 2006 census to be included; two data series for Italy • Other: Japan? Non-OECD countries?
Data sources, coverage, limitations • 4 types of data sources used: • Dedicated CDH surveys (census or sample) • Register data (Nordic countries) • Other established surveys (census and LFS) • A combination of the above • Higher response rates for CDH sample surveys (> 50%) than for census surveys • Good coverage of the target population • some difficulties with coverage of foreign doctorate holders
Ten top countries of previous residence of national DH having lived abroad
CDH conclusions • The first results of the 2005 CDH data collection give interesting insights on the situation of doctorate holders in five countries • Progress in the measurement of international mobility by cross-classifying place of birth and citizenship with residential status, length of stay in the country and other variables
CDH conclusions (cont.) • Important value added by introducing the collection of more qualitative information on the perception and plans of doctoral graduates regarding their employment and international mobility • Such qualitative indicators are extremely useful to help understanding the complex patterns of international mobility that cannot only be gauged through quantitative data because of the heterogeneity of migration systems across countries