Performance Evaluation and Quality Indicators in Multi-Objective Optimization
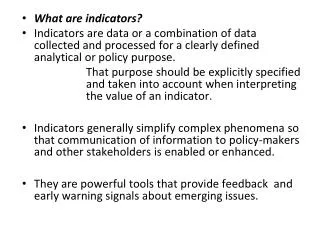
Learn about quality indicators in multi-objective optimization, different types of indicators, unary and binary metrics, domination relations, and the calculation of Binary ε-Indicator. Explore the importance of assessing the quality of approximation sets in real scenarios.


Performance Evaluation and Quality Indicators in Multi-Objective Optimization
E N D
Presentation Transcript
Quality Indicators(Binary ε-Indicator) Santosh Tiwari
Background • Multi-objective optimization ̶ Outcome is an approximation set. • In a real scenario ̶ Actual pareto-optimal set often unknown. • Our motive is to compare approximation sets, not algorithms. • In case of algorithms ̶ multiple runs ̶ distribution of indicator values need to be considered. • Basic idea ̶ x1 is preferable to x2 if x1 dominates x2.
Performance Evaluation of an Outcome • Quality of an outcome ̶ Quantitative description of the result (approximation set) e.g. Convergence, Diversity etc. • Computational resources required ̶ Measured in terms of number of function evaluations required, running time of algorithm etc.
Quality Indicators Three basic types • Unary performance indicators ̶ require only one approximation set. • Binary performance indicators ̶ require more than one approximation set. • Attainment function approach (conceptually different) ̶ Estimating the probability of attaining arbitrary goals in objective space from multiple approximation sets.
Unary Quality Indicators(Few Examples) • Convergence metric ̶ average distance of the approximation set from the efficient frontier – Actual efficient frontier required. • Hyper-volume measure ̶ volume of the objective space dominated by an approximation set. • Diversity metric ̶ chi-square-like deviation measure.
Limitations of Unary Performance Indicators • Cannot indicate whether an approximation set A is better than an approximation set B. • Above statement holds even if a finite combination of unary indicators are used. • Most unary indicators only infer that an approximation set A is not worse than B. • Unary measures that can detect A is better than B are in general restricted in their use. • Binary quality measures overcome all such limitations.
Binary Quality IndicatorsFew Examples • Coverage indicator – fraction of solutions in B dominated by one or more solutions in A. • Binary ε-indicator (detailed description ahead). • Binary hyper-volume indicator – hyper-volume of the subspace that is weakly dominated by A but not by B. • Other indicators e.g. Utility function indicator, Lines of intersection (uses attainment surface) etc.
Domination Relation for Objective Vectors • Weak Domination • Domination • Strict Domination • Non-dominated (Incomparable) Approximation set is a set of incomparable solutions
Domination Relation in Approximation Sets Every objective vector in B is weakly dominated by at least one member in A. A weakly dominates B but B does not weakly dominate A. Every objective vector in B is dominated by at least one member in A. Every objective vector in B is strictly dominated by at least one member in A.
Binary ε-Indicator (Definition) • ε-domination (multiplicative) • Binary ε-indicator Iε(A,B) Minimum value of ε (>0) for which every member of an approximation set B is weakly ε-dominated by at least one member of approximation set A.
Computation of Iε(A,B) Time Complexity O(n.|A|.|B|)
Algorithm to compute Iε(A,B) • Step 1: Find the ideal point of the combined sets (A & B). • Step 2: Translate both the approximation sets such that ideal point is situated at (1, 1, …, 1) in n-dimensional hyper-space. • Compute • Finally,