

ABSTRACT
E N D
Presentation Transcript
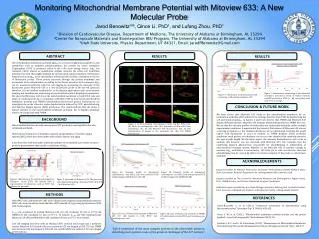
The mitochondrial membrane potential () is a crucial biophysical parameter in cell metabolism such as oxidative phosphorylation, the process by which Adenosine Triphosphate (ATP) is produced, which is the cell’s main energy source. has remained rather elusive to quantitative analysis whereas the whole-cell membrane potential has been thoroughly analyzed by several patch-clamp techniques. Noninvasive measurements of in the intracellular milieu has been strictly constrained to the use of fluorescent probes. These probes permeate through the plasma membrane and accumulate in the mitochondria according to the Nernst equation. In this manner, can be measured indirectly with live cell imaging by measuring the intensity of the fluorescent probe. Mitoview 633 is a new fluorescent probe in the far-red spectrumtherefore, it is an excellent candidate for co-localization applications such as ratiometric imaging and simultaneous monitoring of several mitochondrial biophysical parameters. We show that Mitoview 633 stains the mitochondrial membrane in both H9C2 cells and adult rat cardiomyocytes by co-localization with Mito-eYFP(a fluorescent mitochondrial membrane protein) and TMRM (mitochondrial fluorescent probe). Furthermore, we investigate the probe’s kinetics under depolarization induced by FCCP, photobleaching, and Reactive Oxygen Species (ROS) production. The results indicate that the probe is indeed sensitive to the mitochondrial membrane potential, but it displays dissimilar kinetics in comparison with TMRM. Cottet-Rousselle, C., et al. (2011). "Cytometric assessment of mitochondria using fluorescent probes." Cytometry Part A 79A(6): 405-425. Perry, S. W., et al. (2011). "Mitochondrial membrane potential probes and the proton gradient: a practical usage guide." Biotechniques 50(2): 98. Scaduto Jr, R. C. and L. W. Grotyohann (1999). "Measurement of Mitochondrial Membrane Potential Using Fluorescent Rhodamine Derivatives." Biophysical Journal 76(1): 469-477. ABSTRACT BACKGROUND METHODS Figure 3. Confocal imaging co-localization results. (A) Rat H9C2 cells. (B) Adult rat cardiomyocyte cells. (A1) Expression of Mito-eYFP after transfection. (A2, A5, B2) Mitoview 633 fluorescence. (A3, A6, B3) Superposition of images to the immediate left. (A4, B1) TMRM fluorescence. RESULTS RESULTS Both H9C2 and Cardiomyocyte cells were cultured and prepared using standard protocols. H9C2 cells were transfected with the Mito-eYFP plasmid (2.5 μg) using lipofectminne 3000 (Life Technologies). was monitored by loading Mitoview 633 (10 nM, incubated 30 min at 37°C) and TMRM (25 nM, incubated 10 min at 37°C ). To monitor and ROS simultaneously Mitoview (10 nM) and MitoSOX (4 μM, incubated 30 min at 37°C ) were loaded. Live cell imaging was done with an Olympus IX81 confocal microscope and a perfusion system. Mitoview 633 loaded cells were excited at 622 nm imaged at 655-755 nm, TMRM was excited at 546 nm imaged at 550-620 nm, and MitoSOX was excited at 515 nm imaged at 550-620 nm. CONCLUSION & FUTURE WORK We have shown that Mitoview 633 binds to the mitochondrial membrane by co-localization with Mito-eYFP and that it is a Voltage Sensitive Dye (VSD) by depolarizing the cell and monitoring. In figures 4 and 5 we observe that TMRM and Mitoview 633 display different kinetics. Mitoview 633 displays photoblinking whereas TMRM does not. We see that the intensity profiles of both probes are statistically dissimilar under multiple experimental conditions. It appears that the intensity fluctuations of Mitoview 633 are not occurring at random, i.e. the standard deviations are not distributed normally. We would expect such fluctuations to occur at random, as TMRM displays. Under perfusion conditions small pockets of turbulence can occur in the chamber that randomly perturbs the optical path length. We therefore expect the intensity fluctuations to also occur at random; this however was not observed with Mitoview 633. This indicates that the underlying physical phenomenon responsible for photoblinking is independent of mitochondrial brownian motion. Whether or not Mitoview 633 is sensitive enough to measure oscillations is inconclusive. We have yet to rule out that the observed photoblinking may be caused by either an intrinsic property of the probe or interactions with ROS. ACKNOWLEDGEMENTS Support provided by National Aeronautics and Space Administration (NASA)-Alabama Space Grant Consortium, Research Experiences for Undergraduates (REU) award to UAB. Support provided by The Center for Nanoscale Materials and Biointegration, Yogesh Vohra, Ph.D., CNMB Director, and CharitaCadenhead, Program Coordinator. Additional support provided by the Cardio Biology Laboratory, KahYongGoh, Graduate Student, Kevin Acreman, Undergraduate Student, and Dedra [last name], Undergraduate Student. Mitochondrial function not only encompasses ATP production and regulation but also cell health and death. Dysfunctions include loss of metabolic capacity and production of reactive oxygen species (ROS), which have been linked with cardiac disease and aging. It has been observed that under sufficient oxidative stress metabolic processes are more prone to perturbations that result in oscillations of . ¹Division of Cardiovascular Disease, Department of Medicine, The University of Alabama at Birmingham, AL 35294 ²Center for Nanoscale Materials and Biointegration REU Program, The University of Alabama at Birmingham, AL 35294 ³Utah State University, Physics Department, UT 84321, Email: JarodPBenowitz@Gmail.com Jarod Benowitz¹²³, Qince Li, PhD¹, and Lufang Zhou, PhD¹ Monitoring Mitochondrial Membrane Potential with Mitoview 633: A New Molecular Probe Figure 7. Simultaneous monitoring of mitochondrial membrane potential in terms of relative intensity and ROS production. FCCP (1 M) was added to the culture via a syringe. Figure 6. Illustration of mitochondrial ROS production with protein complexes I-IV. • Figure 4A. Intensity profile of depolarized cardiomyocte and H9C2 cells with perfused FCCP (1µM). Imaged with Mitoview (10 nM). • Figure 4B. Intensity profile of depolarized cardiomyocte and H9C2 cells with perfused FCCP (1µM). Imaged with TMRM (25 nM). Figure 1. Illustration of the mitochondrial Electron Transport Chain (ETC). The cylinder DNP is representative of substances such as FCCP that collapse the potential. Figure 2. Spectrum of Mitoview 633. The spectrum was obtained by loading a Nanodrop 3000 with 200 M of Mitoview 633. • REFERENCES • Figure 5A. Loss of fluorescent intensity of Mitoview 633 (10 nM) loaded in both H9C2 and Cardiomyocyte cells. • Figure 5B. Loss of fluorescent intensity of TMRM (25 nM) loaded in both H9C2 and Cardiomyocyte cells. “Life is comprised of the most complex systems in the observable universe, describing such systems is one of the greatest challenges of the 21st century.”


