Download

1 / 11
110 likes | 130 Vues
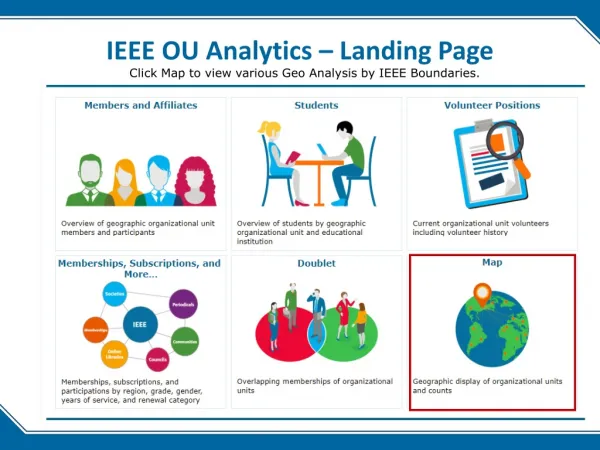
Get an overview of IEEE members and society affiliates by geographic organizational units. Access predefined tables and charts, filter data by region, grade, and IEEE status, and download member information.

E N D
IEEE OU Analytics • The Members and Affiliates Dashboard provides an overview of IEEE members, society affiliates, and SA members by their geographic organizational units. • An overview count of members by Region, Council, Section and Subsection is available. • There are multiple visualizations: • Table of Count by Grade • Pie chart of Count by Gender • Bar graph for Count by Technology Focus Area • Bar graph for Count by Grade and Gender • Members and Affiliates - Dashboard
IEEE OU Analytics • There are three tabs available. • Dashboard – shows the predefined tables and charts available for a breakdown view of your members. • Employer Information – shows members and their employers data by region, geographic council, section and subsection. • Detail – contains the individual member information. Access the member information by using “View Details” in Tool Tips or clicking on “Detail” tab. • Detail shows member contact information. • Download contains additional fields depending on dashboard. • Members and Affiliates - Dashboard
IEEE OU Analytics • Count by Region and Grade • The data table is grouped by Region, Council and Section. If you have a Subsection, breakdown can be expanded by clicking on the expand button located in the middle of the Section column title. • Users can filter their view by Region, Grade and IEEE Status. • Views may display other Regions/Sections. These other geographic areas displayed represent the preferred address (e.g. home) of students attending school in your Region/Section. For example, a Connecticut section chair will see the Santa Clara Valley Section displayed because of a student attending the University of Connecticut (in Connecticut Section) who resides in the Santa Clara Valley Section. • Members and Affiliates - Dashboard
IEEE OU Analytics • To further define your view to a specific section, click your cursor on the Section name. The view will appear highlighted in blue. • Click on Revert or white space on page to remove the view. • Members and Affiliates - Dashboard
IEEE OU Analytics • Hover over any visualization to display a Tool Tip. The tool tip gives further statistical information regarding that specific count or visualization. • Members and Affiliates - Dashboard • To lock in a detailed view, such as your Section members only, click on the Section name in the table, hover over column and a tool tip will appear. Select “Keep Only” and this view will be locked. When locked, this selection will carry throughout other visualizations.
IEEE OU Analytics • Within the tool tip, user can also select “View Details” This brings you to the Details View which will only include the member records for the selected data. Download by clicking in the data table header (grayed out area) and then clicking on download on the top right of screen. Download may include additional member details. • Members and Affiliates - Dashboard • Count by Gender (pie chart) – will display all results or results based on filter and/or further definitions. • Count by Technology Focus (bar graph) – will display all results broken down by the 16 Technology Focus Areas. Results based on filter and/or further definitions. • Count by Grade and Gender (bar graph) – will display Gender breakdown (bar) by Grade. Results based on filter and/or further definitions.
IEEE OU Analytics • Members and Affiliates – Employer Information • Refine data through filters – Filter on Region, Section, Grade, IEEE Status, Member #, Member Name or specific Employers. • Results in table view – Once you have selected your filters, to download, click within the “grey” table header to select your data. Select the “download” link located in the top right corner. Select Crosstab and then download. • Download results – The download results include member information, primary employer name, employer type, line of business, job function, job responsibility, title, and work address and more. The download from the “Employer Tab” is different from what is available on the “Details” tab.
IEEE OU Analytics • The Details tab displays a table with member contact information. • The tab will carry through any filters that are selected on the “Members and Affiliates – Dashboard” • Download information contains additional fields such as: renew year; full address, technology focus area; society list; HKN information; contiguous flag; and contact preferences. • To download click within the “grey” table header to select your data. Select the “download” link located in the top right corner. Select Crosstab and then download. • Members and Affiliates - Detail
IEEE OU Analytics • If you have any questions regarding the new tool or need further assistance send an email to ouanalytics@ieee.org • Here are additional contacts: • Questions & Assistance GEOGRAPHIC ORG UNITS CONTACTS Helen Shiminsky (primary) Email: h.shiminsky@ieee.org +1 732 562 5517 Vera Sharoff (alternate) Email: v.sharoff@ieee.org +1 732 552 5509 SOCIETY ORG UNITS CONTACTS Mary Curtis (primary) Tina Cordeiro (pimary) Email: m.curtis@ieee.org t.cordeiro@ieee.org +1 732 562 3904 +1 732 562 5329 Rosanne Loyal (alternate) Email: r.loyal@ieee.org +1 732 562 3903