Download
1 / 11
110 likes | 125 Vues
This report provides an overview of health and mortality trends among individuals with mental retardation served by the Connecticut State Department of Mental Retardation. It includes data on the population served, residential support, and mortality rates.

E N D
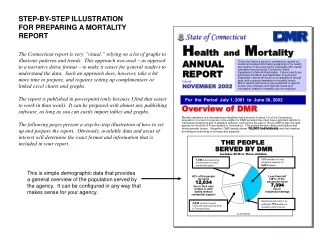
HealthandMortality ANNUAL REPORT Issued NOVEMBER 2002 This is the first of a series of semiannual reports on trends and related information pertaining to the health and quality of care received by individuals with mental retardation served by the Connecticut State Department of Mental Retardation. Future reports are scheduled for March and September of each year. September reports will focus on an analysis of annual data, with a special emphasis on mortality trends. March reports will focus on any significant or special trends, new initiatives and important news and information related to mortality and risk reduction. For the Period July 1, 2001 to June 30, 2002 Overview of DMR Mental retardation is a developmental disability that is present in about 1% of the Connecticut population. In order for a person to be eligible for DMR services they must have significant deficits in intellectual functioning and in adaptive behavior, both before the age of 18-yrs. DMR is also the lead agency for the Birth to Three System in Connecticut. This system serves infants and toddlers with developmental delays. Altogether, DMR assists almost 19,500 individuals and their families, providing a broad array of services and supports. THE PEOPLE SERVED BY DMR Includes Birth to Three children. 7,186 individuals living at home without formal residential support DMR provides or funds residential supports for 6,621 people. 62% of the people we serve 12,034 live in their own homes or with family without residential support Less than half (38%) of the people we serve 7,394 live in residential settings Residential services for an additional 773 people are funded by other sources. 4,848 children living at home and receiving only Birth to Three services as of 6/30/02 STEP-BY-STEP ILLUSTRATION FOR PREPARING A MORTALITY REPORT The Connecticut report is very “visual,” relying on a lot of graphs to illustrate patterns and trends. This approach was used – as opposed to a narrative dense format – to make it easier for general readers to understand the data. Such an approach does, however, take a bit more time to prepare, and requires setting up complimentary or linked excel charts and graphs. The report is published in powerpoint (only because I find that easier to work in than word). It can be prepared with almost any publishing software, as long as you can easily import tables and graphs. The following pages present a step-by-step illustration of how to set up and prepare the report. Obviously, available data and areas of interest will determine the exact format and information that is included in your report. This is simple demographic data that provides a general overview of the population served by the agency. It can be configured in any way that makes sense for your agency.
This data simply reflects the no. and percent of deaths by where people lived (categories). You can configure any way you want (usually it is helpful to distinguish between persons who receive direct residential services from those who do not and from those for whom another agency may have responsibility (e.g., LTC). Health& Mortality Review ANNUAL REPORT September 2002 Mortality Trends An important component of the risk management systems present within DMR involve the analysis and review of deaths to identify important patterns and trends that may help increase knowledge about risk factors and provide information to guide system enhancements. Consequently, DMR collects information on the death of all individuals served by the department. The following section provides a general description of the results of this analysis for Fiscal Year 2002 (July 2001 through June 2002). Excel chart set up as follows: Type of Residential Support At Time of Death Mortality and Residence During the 12 month time period between July 1, 2001 and June 30, 2002 a total of 178 out of the 19,500 individuals served by DMR passed away. As can be seen in the graph to the right approximately half died while being served in a residential setting operated, funded or licensed by DMR (blue section). The other half were living at home (family home or independently), in a long-term care facility (e.g., nursing home), or other non-DMR setting . This general pattern is consistent with that observed last fiscal year, although there was a slight reduction in the relative percentage of deaths that occurred in CLAs, Supported Living and Long-Term Care facilities. The average Death Rate* is expressed as the no. of deaths per 1000 people served. It compares the number of deaths to the number of persons served in each type of setting (no. deaths /population X1000), and continues to show a predictable pattern: In general, the higher need for specialized care, the higher the average rate of death. This data represents death RATE, with table set up so that it moves from lowest to highest. Rate is a good indicator since it allows general comparisons that compensate for differences in the population size. (If you use similar groupings you will have CT and MA data as a benchmark.) This graph shows the number of people who died for every 1000 people served in each type of setting. The settings to the left tend to provide less comprehensive care and support than the settings to the right. This often reflects the level of disability and specialized care needs of the people who generally live in each type of setting. For example, persons living in LTC (nursing homes) tend to be older than other people served by DMR, and, usually went to a nursing home because they needed skilled nursing care. Their death rate is much higher than for other people served by DMR. Excel chart set up as follows: * In this report we use the term “average death rate” to reflect what is more commonly referred to as the “crude” death rate in mortality and epidemiological research. -2- Home = people living with families or independently; SL = supported living; CTH= Community Training Home (foster care); CLA= Community Living Arrangement (group home); Campus = regional centers and STS (institutions); LTC=Long Term Care (Nursing Homes, SNFs, etc.); Other = Everything else.
This data simply compares the past two years in terms of the total no. deaths and the death rates. As time goes on, additional years (reflecting trends) will be included. Health& Mortality Review ANNUAL REPORT September 2002 Health& Mortality Review ANNUAL REPORT September 2002 Excel chart set up as follows: The two graphs to the right compare the number of deaths within the population served by DMR and the average death rate for fiscal years 2001 and 2002. As can be seen, FY02 experienced a slight decrease in both measures. This graph compares the death rate (the number deaths per 1000 persons served) for fiscal year 2002 with that for last fiscal year (FY2001) by type of residential setting. Small differences can be seen, with the rate decreasing for persons living in CLAs (group homes) and in Campus settings (STS and regional centers). The most pronounced decrease occurred for persons receiving Supported Living services. Slight increases in the mortality rate occurred for persons living in Long-Term-Care facilities and their family homes Rate by residential setting across the two years is shown here. This is useful to identify any emerging trends. Uses same excel chart as above Caution must be exercised in reviewing this data since the actual number of deaths in each of these settings was relatively small. The differences across this time period are therefore most likely not statistically significant. Comparison of death rate by gender is a common (and almost expected) type of analysis. It is useful since there is a lot of data of differential rates (e.g., CDC). Make sure you also look at age – higher death rates for women may be reflective of the fact that their average age is higher. Gender and Mortality During Fiscal Year 2002 a little over half (52%) of the 178 individuals who passed away were men. However, DMR serves more men than women. The No. Deaths per 1000 people served shows that women tend to have a higher death rate. It is important to note, however, that the average age of women served by DMR is greater than the age of men, with almost two times as many females over the age of 85-yrs than males. Thus, a higher death rate for women would be expected since they are, as a group, older than the men served by the department. Excel chart set up as follows: -3-
Age is probably the most common type of analysis for mortality since it is the strongest predictor of death and there are numerous benchmarks you can look at (including data specific to a given state). Data reflects a basic frequency distribution, converted to rates (no. divided by total no. served in the age range). You can expand or compress the age ranges to best reflect the population you serve or specific program/service categories. Health& Mortality Review ANNUAL REPORT September 2002 Age and Mortality Excel chart set up as follows: The relationship between age and mortality shows the expected trend, with the mortality rate increasing as people served by DMR get older. As seen here, at around 70 -yrs of age there is a dramatic rise in mortality, again, in line with expectations and the trends observed in the general population. Individuals living at home (especially those living with their family) are younger than the other persons served by DMR. They also have a much younger average age at death. The oldest group served by DMR are living in LTC facilities. They have the highest average age at death. This table is a summary of above data used for direct import into the report. As can be seen in this graph there is a relatively strong relationship between the average age of the population living in each type of residential setting and their average age at death. The largest difference between the two variables exists in CLAs, where the average age of death is 13-yrs higher than the average age of the population living in this type of setting. This analysis may not be necessary. It was included due to erroneous reporting by the Hartford Courant and to illustrate that there is NOT any adverse risk for people living in CLAs. If you decide to include something like this, it will be necessary to compute the average age of persons in each type of residential setting and the average age of death for people in those settings. -4-
This data simply reflects the relationship between MR level and mortality rate. You can do something very similar with any data re: client characteristics as long as you can group your population according to the variable (e.g., ICAP scores on selected functional or diagnostic categories/levels). The average rate is illustrated by the dashed line (to allow easy identification of levels above and below the average). Health& Mortality Review ANNUAL REPORT September 2002 Level of Disability and Mortality In addition to age and gender, the level of mental retardation is another factor that affects a person’s life expectancy. Persons with more severe levels of disability typically have many co-morbid conditions (other medical diagnoses such as epilepsy, cerebral palsy, etc.), including mobility and eating impairments. These disabilities have a significant effect on morbidity (illness) and mortality. As can be seen in this graph, the relationship between level of mental retardation and mortality shows the expected trend. Persons with the most significant levels of mental retardation (severe and profound) have a much higher rate of mortality. Excel chart set up as follows: No MR or ND category Includes children receiving DMR services through the Birth-to-Three system who are too young to test for mental retardation and adults for whom the DMR has limited responsibility under the Federal Nursing Home Reform Act (OBRA 87) who do not have mental retardation. It may include some DMR clients who were DMR clients prior to Connecticut’s current statutory definition of mental retardation. During FY 2002 (July 1, 2001 to June 30, 2002) 123 cases were formally reviewed by DMR Mortality Review Committees. The information presented in the next section summarizes ONLY those deaths that were reviewed and will therefore be different from the numbers discussed in the preceding section. Information regarding FY02 reviews will be presented for ALL CASES REVIEWED and for only those deaths that OCCURRED DURING FY02. The following sections of the report require additional data that may not be readily available without a specific database associated with the process of mortality review. You do have data on whether the death was “natural” or “accidental” as well as a few other very general categories. (Recommend you decide what type of information you want to report on and then incorporate into your reporting format and process.) DMR Mortality Review DMR policy establishes formal mechanisms for the careful review of consumer deaths by local regional Mortality Review Committees and a central Medical Quality Assurance Board. This latter entity, modified by the Governor’s Executive Order No. 25, is now called the Independent Mortality Review Board (IMRB) and includes representation from a number of outside agencies as well as a consultant physician. During FY02 a total of 123 cases were reviewed by these local committees and the central IMRB. Of these, 58 cases were referred by local committees to the IMRB, and an additional 14 (11%) cases of the 65 closed at the local level were reviewed centrally as a quality assurance audit. Of the 123 cases that were reviewed, 41represented deaths that occurred during FY02. Information regarding these deaths is summarized separately below. IMPORTANT FINDINGS From Mortality Reviews: This data reflects deaths associated with hospice (and therefore “expected.” Community Hospice Support is routinely provided for persons served by DMR in all types of residential settings, including regional centers and STS, CLAs, CTHs, and for individuals receiving supported living services when death is anticipated, usually due to a terminal illness. ALL CASES REVIEWED: Hospice support was provided in 24 of the 123 cases reviewed (20%) FY02 DEATHS ONLY: Hospice support was provided for 14 of the 41 individuals who died (34%) Excel chart set up as follows: -5-
All of this data had to be reported in two different ways since the mortality review process is always a bit behind the actual fiscal year, and, given the heightened attention to death that year, it was important to present info on both the total no. of reviews as well as only those deaths that occurred in that year. Most of the data is self-explanatory. The categories chosen for inclusion tended to be “hot button” issues where real objective information can “calm the storm.” Health& Mortality Review ANNUAL REPORT September 2002 Autopsiesare performed by the Office of the Chief Medical Examiner for those cases in which the OCME accepts jurisdiction or by private hospitals when DMR requests and the family consents to the autopsy. ALL CASES REVIEWED: Of the 123 individuals reviewed, autopsies had been requested for 48 (or 39% of the sample), and consent was obtained and autopsies performed for 26 (21% of the sample). The OCME accepted jurisdiction and performed autopsies for 15 of these cases, and private autopsies were conducted for 11. FY02 DEATHS ONLY: Of the 41 deaths that occurred during FY02, autopsies were requested for 22 (54%). A total of 8 autopsies were performed (20%), 5 of which were conducted by the OCME. Special Note: A recent report by the Columbus Organization found that the average rate of autopsy for persons served by those state MR/DD agencies they surveyed was 11.7%. This compares to the 20-21% rate noted above for cases reviewed by mortality review committees in Connecticut during FY02. Predictability. ALL CASES REVIEWED:In 64% of the cases reviewed (n=79), the death was anticipated and related to the diagnosis. In another 24% of the cases (n=29) the death was not anticipated, but was directly related to the existing diagnosis. In 12 % (n=15) the death was not anticipated and not related to the diagnosis, as follows: 1 – heart anomaly 2 – asphyxia (drowning) 3 – cardiovascular disease 1 – subdural hematoma 1 – adverse drug reaction 1 – stroke 2 – pulmonary embolism (1 following surgery) 1 – pneumonia 2 – inhalation of food 1 – cause undetermined by OCME FY02 DEATHS ONLY: Of the 41 deaths reviewed that occurred in FY02, 56% (n=23) were anticipated and related to the known diagnosis, 32% (n=13) were not anticipated but were related to the existing diagnosis, and 12% (n=5) were not anticipated and not related to the diagnosis, as follows (also included above): 1 – cardiovascular disease 1 – stroke 1 – adverse drug reaction 1 – pulmonary embolism following orthopedic surgery 1 – cause undetermined by OCME DNR.Do Not Resuscitate (DNR) orders are sometimes utilized when individuals reach the terminal phase of an illness. DMR has an established policy that includes specific criteria that must be met along with a review process for all DNR orders issued for persons served by the department. ALL CASES REVIEWED: Of the 123 cases reviewed, 71 people (or 58%) had DNR orders, indicating that their condition was terminal. Of these, 67 were formally reviewed by DMR. For the remaining four individuals, DMR was not notified as required by policy, but in all cases the DNR was appropriate and would have met established criteria. Of these four, two occurred at a LTC facility, one at an acute care hospital , and the fourth at a Hospice facility. All facilities received additional training regarding required notification to DMR. FY02 DEATHS ONLY: Of the 41 deaths that occurred in FY02, 15 had DNR orders (37%). All met DMR policy requirements (met criteria, and both notification and review took place as required). Risk. Mobility impairments and need for special assistance eating are two factors that place individuals at significantly higher risk of death. The mortality review process therefore looks carefully at the presence of these two personal characteristics. ALL CASES REVIEWED: Of the 123 individuals reviewed, 54 – or 44% were non-ambulatory. 62, or 50%, were not able to eat independently. FY02 DEATHS ONLY: Of the 41 FY02 deaths reviewed, 18 (44%) had mobility impairments (non- ambulatory) and 10 (24%) were not able to eat independently. Excel charts set up as follows: Note: your mortality review process will need to be structured to generate specific kinds of data and conclusions in order to provide this type of data for a report. -6-
Context is similar to the data you collect. (Recommend you carefully review the reliability of the reporting, especially to see if later review causes changes to be made.) Health& Mortality Review ANNUAL REPORT September 2002 SUMMARY Deaths that Occurred and Were Reviewed between 7/1/01 & 6/30/02 Context. ALL DEATHS REVIEWED: The vast majority – over 90% - of all deaths reviewed were classified as due to Natural Causes. Six (6)deaths were associated with an Accident. Of these, 2 were related to choking, 2 were related to drowning, and 2 appear to be related to a fall. One case was a Homicide and in one case the context was not able to be determined by the OCME. FY02 DEATHS ONLY: 39 deaths – or 95% - of the 41 reviewed were related to natural causes. 1 death was accidental and 1 was not able to be determined by the OCME. The accidental death was related to a fall. Neglect. ALL DEATHS REVIEWED: There were a total of 18 allegations of abuse or neglect that occurred within 6 months of death for the cases reviewed. Of these, 2 were not substantiated, 8 are still under investigation, and 8 were substantiated. In 4 of these latter cases, the neglect appeared to be related to the cause of death, as follows: 2 - asphyxia resulting from drowning (private CLAs) 1- anoxia, associated with nursing failure to properly assess (LTC) 1 - anoxia resulting from choking on food (private day program) Enforcement action was taken in 3 of the 4 cases and included: 2 dismissals from service by the provider with arrest by police and 1 citation with monetary fine by DPH (1). In the fourth case there were inconsistent findings regarding the culpability of the involved staff member. In all four instances family members were notified of findings. FY02 DEATHS ONLY: Of the 41 deaths that occurred in FY02 there were a total of 8 that included an allegation of abuse or neglect within 6-months of death. Of these, 1 was not substantiated, 5 are still under investigation, and in two cases the neglect was substantiated. In both of these latter two cases it was not possible to determine if the neglect was the direct cause of the deaths. Both cases involved nursing personnel where enforcement action included appropriate reporting to the Department of Public Health and Nursing Board. Excel chart set up as follows: • 34%of the people hadHospicesupport. • 20% had an Autopsy. • 56% of the deaths were Anticipatedand related to the existing diagnosis. In 12% the death was not anticipated and not related to the existing diagnosis. • 37% had a DNR order. All met DMR criteria. • 44% of the people could Not Walk (i.e., were non-ambulatory). • 24% could Not Eat without assistance. • 95% of all the deaths reviewed were due to Natural causes. • 1 death was classified as Accidental. • 2 cases involved Neglect that was substantiated. In both cases it was not possible to determine if the neglect was related to the cause of death. Neglect data reflects whether or not there was an allegation of abuse or neglect within 6 mo. of the death. Therefore, it was important to also note whether or not the neglect was related to the death (which only an investigation or mortality review process can determine) Excel chart set up as follows: -7-
Location at time of death may be important to look at, particularly if questions get raised about the care being provided within programs operated or funded by your agency. It can be useful to show that a majority of deaths take place within hospitals and LTC (as would be expected). However, to do this, you will need to capture that data either on the IR form or through mortality review. Health& Mortality Review ANNUAL REPORT September 2002 Location at Time of Death As can be seen in this graph over 60% of the individuals reviewed by the mortality review committee in FY02 passed away outside of a DMR - operated or funded residential setting. Most died in the hospital or long term care facility. The table below shows both the number of individuals who died by location as well as the relative percentage by location. Excel chart set up as follows: Where People Died FY 2002 Mortality Reviews LEADING CAUSES OF DEATH A review of data from Connecticut and two other New England states suggests that the leading causes of death for people with mental retardation are somewhat different than for the general population. Heart disease is the no. 1 cause of death – for all groups. However, unlike the general population, deaths due to respiratory conditions are the second leading cause of death for individuals served by DMR. This is expected due to the high percentage of deaths for persons with severe and profound mental retardation and the high incidence of co-morbid conditions in that group, including conditions such as cerebral palsy, dysphagia, gastro-esophageal disorders, all of which carry a heightened risk of aspiration pneumonia. It should be noted that increasing age is an important factor that increases risk for aspiration pneumonia as documented in the National Vital Statistics Report published by the CDC.1 This report states that a major cause of death “concentrated among the elderly, is a pneumonia resulting from aspirating materials into the lungs.” Diseases of the nervous system are the third leading cause of death for DMR consumers. These include Alzheimer’s Disease – which has a very high incidence in people with Down Syndrome - and Seizure Disorders, again a condition that has a much higher incidence in people with mental retardation. Interestingly, deaths due to accidents are much lower for people with mental retardation than for the general U.S. or Connecticut population. Deaths due to injuries or accidents are the 5th leading cause of death in the general population , but are only the 8th highest cause of death for people reviewed by DMR’s mortality review committees. Leading causes of death is VERY important. IT is also a variable that has ample benchmarks. You can use SD data as well as national data (for both the general population and, given published mortality reports, for the MR/DD population as well – just make sure there is an ability to directly compare DD populations since some states only serve MR, some report only on adults, etc.). Leading Causes of Death -8-
Health& Mortality Review ANNUAL REPORT September 2002 Benchmarking is becoming more and more critical since it provides a means to assess whether or not your state is “typical” or an outlier. It will be important to scan the web and stay in touch with other states to get copies of mortality data and reports as they become available. Be very CAREFUL, however – not all data is comparable. CT and MA have similar systems – communicate a lot – and therefore can usually use one another as a benchmark. (Check with Wanda to see if she was able to get the report from Gerry Morrisey.) BENCHMARKS While there is a dearth of objective information regarding mortality in persons with mental retardation being served by state agencies from across the country, this section will provide comparative analysis when appropriate benchmarks do become available. Massachusetts DMR The Massachusetts Department of Mental Retardation has recently enhanced and expanded its mortality reporting requirements and has issued an annual report. This 2000 Mortality Report was prepared by the University of Massachusetts Medical School/Shriver, Center for Developmental Disabilities Evaluation and Research2. The report covers the calendar year January 1 through December 31, 2000. Mortality statistics pertaining to persons 18-years and older served by DMR were analyzed according to a number of variables not dissimilar from many of those contained in the first part of this report. Consequently, it is possible to use some of the Massachusetts data for comparative purposes. It should be noted that the Massachusetts DMR system, although larger, is very similar to Connecticut’s (e.g., population served, type of services and supports, organization). However, there are differences in reporting requirements, age limits, and and categorization of service types. It is therefore important that readers exercise caution when reviewing comparative information. Overall Death Rate A comparison of the overall death rate for persons served by the Connecticut DMR with similar rates for the general population in the U.S. and the DMR population in Massachusetts are presented in this graph. The overall Connecticut DMR death rate of 12.1 deaths per thousand people is higher than the rate of 8.7 deaths per thousand people in the general population, as would be expected due to the many health and functional complications associated with disability and mental retardation. A comparison of the Connecticut DMR with Massachusetts DMR shows a slightly higher death rate in Connecticut for the adult population (people older than 18-yrs of age.) of 0.8 deaths per thousand people served. This difference does not appear to be significant and may be a reflection of the aforementioned differences in the populations being served. Excel charts set up as follows: Residential Analysis A comparison of average death rates by where people live is presentedhere. The general pattern for rates by type of setting is quite similar across the two states, with the exception of the “Other” category. This is most likely a reflection of differences in the populations included in this cluster. Death rates in DMR would therefore appear to be very consistent with an available benchmark as reported in Massachusetts. -9-
This page is purely optional. Including it shows that the department is paying attention to what is happening nationally, and in a way “forces” staff to take time to scan national literature. If you conduct any statistical studies (e.g., relationship between ICAP and mortality, or other types of incidents and mortality) it would be most beneficial to summarize findings in this section of the report. Health& Mortality Review ANNUAL REPORT September 2002 RESEARCH & REPORTS OF INTEREST This section will report on selected research, reviews, and other information from Connecticut and around the country that is related to mortality and health care in mental retardation and developmental disabilities systems. • Connecticut DMR Independent Study on Mortality • The Connecticut DMR retained the services of two outside consultants to conduct a comprehensive analysis of mortality and basic demographic trends from 1997 to 2002 within the population of individuals served by DMR. The study was designed to provide: • Descriptive Overview of People Served by DMR • Predictive Mortality Analysis • Cross-sectional Analysis of People Served • Longitudinal Analysis (Changes over Time) • Using sophisticated statistical procedures the study authors found that: • Changes in mortality rates over time are not significant • As expected, mortality is highly related to client age • Women served by DMR are older than men, and hence have a higher mortality rate • Increased levels of disability are inter-related and correlated with higher risk of mortality • The strongest predictors of mortality are age, mobility status, and amount of supervision provided • The “aging in place” phenomenon is leading to increased risk of mortality since individuals served by DMR are becoming older and more disabled over time. • Copies of the report3 and a graphical summary can be obtained by contacting: DMR Strategic Leadership Center 860-418-6163 or steven.staugaitis@po.state.ct.us • California Study of National Mortality Review Systems • The Columbus Organization conducted a survey of national mortality review practices in MR/DD systems for the California DDS4. Survey findings indicate that: • The majority of states require reporting of deaths for persons served by state DD agencies at both the local and statewide level. • In most instances the determination to perform an autopsy is based upon the unique circumstances of each case, with an average of 11.7% of all cases having an autopsy. • About half of the states use a set of standardized criteria to review deaths. • The majority of states have established databases to track mortality information. • The Columbus report was published in May of 2002. Copies can be obtained by contacting Columbus at • 800-229-5116. References 1Minino, M.P.H., Arialdi, M. and Smith, Ed., S.B., CDC National Vital Statistics Reports National Vital Statistics System, Deaths: Preliminary Data for 2000, Volume 49, Number 12, October 9, 2001. 2 2000 Mortality Report: A Report on DMR Deaths January 1 – December 31, 2000. Prepared for the Massachusetts Department of Mental Retardation by the Center for Developmental Disabilities Evaluation and Research at the University of Massachusetts Medical School/Shriver. March 4, 2002. 3 Gruman, C. & Fenster, J. A Report to the Department of Mental Retardation: 1996 through 2002 Data Overview Completed: April 2002. 4The Columbus Organization. Mortality Review Survey: Survey of the States. Submitted to the California Department of Developmental Services. May, 2002. -10-
Health& Mortality Review ANNUAL REPORT September 2002 This section of the report is also optional. It does, however, allow the agency to publicize new initiatives and efforts to enhance services and systems that reduce risk (e.g., improving your IR and MR system). ENHANCEMENTS: Executive Order No. 25 A number of important enhancements to the risk management and mortality review systems in DMR are being implemented in response to Governor Rowland’s Executive Order No. 25. All of these changes are designed to improve communication with families, assure that a rigorous and objective evaluation and review of circumstances surrounding untimely deaths takes place,and to make sure that the review process is independent and free from the potential for conflict of interest. Some of these enhancements include: Stronger Role for Investigations Unit The Connecticut DMR has a unique relationship with the State Police that includes the assignment of a senior Officer to oversee and manage the Investigations Unit. Two trained clinical nurse investigators have joined the unit’s staff and are conducting preliminary screening on all deaths that occur in DMR operated or funded settings to immediately assess the need for a complete A/N investigation. In addition, a Special Investigative Assistant has been appointed to oversee and monitor investigations conducted within the private sector. New Independent Mortality Review Board The Medical Quality Assurance Board has been transformed into a new Independent Mortality Review Board that increases outside representation. The Chairperson was appointed by the Commissioner of DMR, in consultation with the Director of the Office of Protection and Advocacy (OPA). The independent medical professional (physician)and an independent representative from a private sector agency were jointly appointed by the DMR Commissioner and OPA Director. In addition, OPA now has two members. The new IMRB began meeting in March, 2002. Increased Communication with OPA The department is notifying the Executive Director of the Office of Protection and Advocacy of all deaths that occur for persons served by DMR. The Director may request an expedited review by the IMRB, or, may direct that an abuse/neglect investigation be initiated for any case. Consistent Notification of Families New policies and procedures have been implemented to assure that families and guardians are consistently notified of all deaths and the results of investigations and mortality reviews. Families are provided with an opportunity to meet with DMR personnel to review all findings. Posting of Licensing Inspection Reports The department is now requiring visible notice to consumers, families and guardians that the results of DMR licensing inspections are available for review. In addition, DMR is posting summary reports of inspections on the DMR website in order to make access to the information much easier and more widely available to the public. Results of licensing inspections can be viewed at www.dmr.state.ct.us/license.htm. The Next Health and Mortality Review UPDATE Will be issued inMarch of 2003. For more information or to contact DMR please visit us at www.dmr.state.ct.us Prepared by: Steven Staugaitis, Director, Strategic Leadership Center Marcia Noll, Director, Health and Clinical Services -11 -