Download
1 / 51
510 likes | 540 Vues
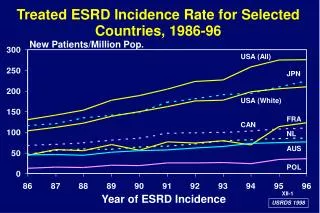
Explore geographic variations in treated ESRD incidence per million population by country for 2013 along with trends from 2000-2013. Analyzing percentage changes in ESRD incidence rates for selected countries reveal insights on diabetes as a primary ESRD cause. Age-specific data is available for 20-44 years old in 2013. Data is sourced from special analyses from the USRDS ESRD Database.

E N D
Figure 13.1 Geographic variations in the incidence of treated ESRD per million population, by country, 2013 Data Source: Special analyses, USRDS ESRD Database. Data presented only for countries from which relevant information was available. All rates are unadjusted. Data for Indonesia represent the West Java region. Data for France include 22 regions. Data for Spain include 18 of 19 regions. Abbreviations: ESRD, end-stage renal disease. Vol 2, ESRD, Ch 13
Figure 13.2 Incidence of treated ESRD, per million population, by country, 2013 Data Source: Special analyses, USRDS ESRD Database. Data presented only for countries from which relevant information was available. All rates are unadjusted. ^United Kingdom: England, Wales, Northern Ireland (Scotland data reported separately). Data for Belgium do not include patients younger than 20. Data for Indonesia represent the West Java region. Data for France include 22 regions. Data for Spain include 18 of 19 regions. Abbreviations: ESRD, end-stage renal disease; sp., speaking. Vol 2, ESRD, Ch 13
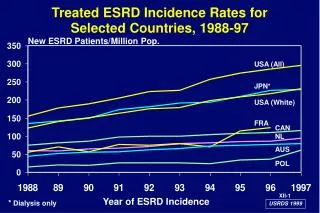
Figure 13.3 Trends in the incidence of treated ESRD, per million population, by country, 2000-2013 Ten countries having the highest % rise in ESRD incidence rate from 2000/01 to 2012/13, plus the U.S. Five countries having the largest % decline in ESRD incidence rate from 2000/01 to 2012/13 Data Source: Special analyses, USRDS ESRD Database. All rates are unadjusted. Data for Croatia are missing from 2006-2011, indicated by the dashed line. Data for U.S. are shown for comparison purposes. Abbreviations: ESRD, end-stage renal disease. Data Source: Special analyses, USRDS ESRD Database. All rates are unadjusted. Abbreviations: ESRD, end-stage renal disease. Vol 2, ESRD, Ch 13
Table 13.1 Trends in the incidenceof treated ESRD, per million population, by country, 2000-2013 (Continueon the next slide) Vol 2, ESRD, Ch 13
Table 13.1 Trends in the incidenceof treated ESRD, per million population, by country, 2000-2013 (Continued) Data source: Special analyses, USRDS ESRD Database. Data presented only for countries from which relevant information was available. Incidence is unadjusted. ^United Kingdom: England, Wales, Northern Ireland (Scotland data reported separately). Japan and Taiwan include dialysis only. Data for France include 15 regions in 2006, 18 regions in 2007, 20 regions in 2008, and 22 regions in 2009-2013. Data for Spain include 18 of 19 regions. Data for Belgium do not include patients younger than 20. Data for Indonesia represent the West Java region. a% change is calculated as the percent difference between the average incidence in 2012 and 2013 and the average in 2000 and 2001. Abbreviations: ESRD, end-stage renal disease; sp., speaking; . signifies data not reported. Vol 2, ESRD, Ch 13
Figure 13.4 Percentage of incident ESRD patients with diabetes as the primary ESRD cause, by country, 2013 Data Source: Special analyses, USRDS ESRD Database. Data presented only for countries from which relevant information was available. ^United Kingdom: England, Wales, Northern Ireland (Scotland data reported separately). Data for Spain include 18 of 19 regions. Data for France include 22 regions. Data for Indonesia represent the West Java region. Data for Belgium do not include patients younger than 20. Abbreviations: ESRD, end-stage renal disease; sp., speaking. Vol 2, ESRD, Ch 13
Figure 13.5 Trends in the incidence of treated ESRD due to diabetes, per million population, 2000-2013 Ten countries having the highest % rise from 2000/01 to 2012/13, plus the U.S. Data Source: Special analyses, USRDS ESRD Database. All rates are unadjusted. Data presented only for countries from which relevant information was available. Data for U.S. are shown for comparison purposes. Abbreviations: ESRD, end-stage renal disease. Vol 2, ESRD, Ch 13
Table 13.2 Trends in the incidence of treated ESRD due to diabetes, per million population, 2000-2013 (Continueon the next slide) Vol 2, ESRD, Ch 13
Table 13.2 Trends in the incidence of treated ESRD due to diabetes, per million population, 2000-2013 (Continued) Data source: Special analyses, USRDS ESRD Database. All rates are unadjusted. Data presented only for countries from which relevant information was available. ^United Kingdom: England, Wales, Northern Ireland (Scotland data reported separately). Data for France include 15 regions in 2006, 18 regions in 2007, 20 regions in 2008, and 22 regions in 2009-2013. Data for Spain include 18 of 19 regions. Data for Belgium do not include patients younger than 20. a% change is calculated as the percent difference between the average incidence in 2012 and 2013 and the average in 2000 and 2001. Abbreviations: ESRD, end-stage renal disease. Vol 2, ESRD, Ch 13
(a) 20-44 years old Figure 13.6 Incidence of treated ESRD, per million population, by age group and country, 2013 Data source: Special analyses, USRDS ESRD Database. All rates are unadjusted. Data presented only for countries from which relevant information was available. ^United Kingdom: England, Wales, Northern Ireland (Scotland data reported separately). Data for Spain include 18 of 19 regions; Data for France include 22 regions. For graph (a) data for Spain include patients 15-44 years old, and data for the United States include patients 22-44 years old. Abbreviations: ESRD, end-stage renal disease; sp., speaking. Vol 2, ESRD, Ch 13
(a) 45-64 years old Figure 13.6 Incidence of treated ESRD, per million population, by age group and country, 2013 Data source: Special analyses, USRDS ESRD Database. All rates are unadjusted. Data presented only for countries from which relevant information was available. ^United Kingdom: England, Wales, Northern Ireland (Scotland data reported separately). Data for Spain include 18 of 19 regions; Data for France include 22 regions. For graph (a) data for Spain include patients 15-44 years old, and data for the United States include patients 22-44 years old. Abbreviations: ESRD, end-stage renal disease; sp., speaking. Vol 2, ESRD, Ch 13
(a) 65-74 years old Figure 13.6 Incidence of treated ESRD, per million population, by age group and country, 2013 Data source: Special analyses, USRDS ESRD Database. All rates are unadjusted. Data presented only for countries from which relevant information was available. ^United Kingdom: England, Wales, Northern Ireland (Scotland data reported separately). Data for Spain include 18 of 19 regions; Data for France include 22 regions. For graph (a) data for Spain include patients 15-44 years old, and data for the United States include patients 22-44 years old. Abbreviations: ESRD, end-stage renal disease; sp., speaking. Vol 2, ESRD, Ch 13
(a) ≥ 75 years old Figure 13.6 Incidence of treated ESRD, per million population, by age group and country, 2013 Data source: Special analyses, USRDS ESRD Database. All rates are unadjusted. Data presented only for countries from which relevant information was available. ^United Kingdom: England, Wales, Northern Ireland (Scotland data reported separately). Data for Spain include 18 of 19 regions; Data for France include 22 regions. For graph (a) data for Spain include patients 15-44 years old, and data for the United States include patients 22-44 years old. Abbreviations: ESRD, end-stage renal disease; sp., speaking. Vol 2, ESRD, Ch 13
Figure 13.7 Incidence of treated ESRD, per million population, by sex and country, 2013 Data source: Special analyses, USRDS ESRD Database. All rates are unadjusted. Data presented only for countries from which relevant information was available. ^United Kingdom: England, Wales, Northern Ireland (Scotland data reported separately). Data for Belgium do not include patients younger than 20. Data for Spain include 18 of 19 regions. Data for France include 22 regions. Abbreviations: ESRD, end-stage renal disease; sp., speaking. Vol 2, ESRD, Ch 13
Figure 13.8 Prevalence of treated ESRD,per million population, by country, 2013 Data source: Special analyses, USRDS ESRD Database. Data presented only for countries from which relevant information was available. The prevalence is unadjusted and reflects prevalence at the end of 2013. ^United Kingdom: England, Wales, Northern Ireland (Scotland data reported separately). Japan and Taiwan include dialysis patients only. Data for Belgium do not include patients younger than 20. Data for Indonesia represent the West Java region. Data for Spain include 18 of 19 regions. Data for France include 22 regions. Abbreviations: ESRD, end-stage renal disease; sp., speaking. Vol 2, ESRD, Ch 13
Table 13.3 Number of prevalent ESRD patients and prevalence of ESRD, per million population, by country, 2000-2013 (Continueon the next slide) Vol 2, ESRD, Ch 13
Table 13.3 Number of prevalent ESRD patients and prevalence of ESRD, per million population, by country, 2000-2013 (Continued) (Continueon the next slide) Vol 2, ESRD, Ch 13
Table 13.3 Number of prevalent ESRD patients and prevalence of ESRD, per million population, by country, 2000-2013 (Continued) (Continueon the next slide) Vol 2, ESRD, Ch 13
Table 13.3 Number of prevalent ESRD patients and prevalence of ESRD, per million population, by country, 2000-2013 (Continued) Data source: Special analyses, USRDS ESRD Database. Data presented only for countries from which relevant information was available. ESRD prevalence is unadjusted and reflects prevalence at the end of each year. ^United Kingdom: England, Wales, Northern Ireland (Scotland data reported separately). Japan and Taiwan includes dialysis only; Israel includes dialysis patients only for 2000-2002. Data for France include 15 regions in 2006, 18 regions in 2007, 20 regions in 2008, and 22 regions in 2009-2013. Data for Spain include 18 of 19 regions. Data for Belgium do not include patients younger than 20. Data for Indonesia represent the West Java region. a % change is calculated as the percent difference between the average prevalence in 2012 and 2013 and the average in 2000 and 2001. Abbreviations: ESRD, end-stage renal disease; sp., speaking; . signifies data not reported. Vol 2, ESRD, Ch 13
(a) 20-44 years old Figure 13.9 Prevalence of treated ESRD, per million population, by age groupand country, 2013 Data source: Special analyses, USRDS ESRD Database. Data presented only for countries from which relevant information was available. The prevalence is unadjusted and reflects prevalence at the end of 2013. ^United Kingdom: England, Wales, Northern Ireland (Scotland data reported separately). Japan and Taiwan include dialysis patients only. Data for Spain include 18 of 19 regions. Data for France include 22 regions. Abbreviations: ESRD, end-stage renal disease; sp., speaking. Vol 2, ESRD, Ch 13
(a) 45-64 years old Figure 13.9 Prevalence of treated ESRD, per million population, by age groupand country, 2013 Data source: Special analyses, USRDS ESRD Database. Data presented only for countries from which relevant information was available. The prevalence is unadjusted and reflects prevalence at the end of 2013. ^United Kingdom: England, Wales, Northern Ireland (Scotland data reported separately). Japan and Taiwan include dialysis patients only. Data for Spain include 18 of 19 regions. Data for France include 22 regions. Abbreviations: ESRD, end-stage renal disease; sp., speaking. Vol 2, ESRD, Ch 13
(a) 65-74 years old Figure 13.9 Prevalence of treated ESRD, per million population, by age groupand country, 2013 Data source: Special analyses, USRDS ESRD Database. Data presented only for countries from which relevant information was available. The prevalence is unadjusted and reflects prevalence at the end of 2013. ^United Kingdom: England, Wales, Northern Ireland (Scotland data reported separately). Japan and Taiwan include dialysis patients only. Data for Spain include 18 of 19 regions. Data for France include 22 regions. Abbreviations: ESRD, end-stage renal disease; sp., speaking. Vol 2, ESRD, Ch 13
(a)≥ 75 years old Figure 13.9 Prevalence of treated ESRD, per million population, by age groupand country, 2013 Data source: Special analyses, USRDS ESRD Database. Data presented only for countries from which relevant information was available. The prevalence is unadjusted and reflects prevalence at the end of 2013. ^United Kingdom: England, Wales, Northern Ireland (Scotland data reported separately). Japan and Taiwan include dialysis patients only. Data for Spain include 18 of 19 regions. Data for France include 22 regions. Abbreviations: ESRD, end-stage renal disease; sp., speaking. Vol 2, ESRD, Ch 13
Figure 13.10 Prevalence of treated ESRD, per million population, by sex and country, 2013 Data source: Special analyses, USRDS ESRD Database. Data presented only for countries from which relevant information was available. The prevalence is unadjusted and reflects prevalence at the end of 2013. ^United Kingdom: England, Wales, Northern Ireland (Scotland data reported separately). Japan and Taiwan include dialysis patients only. Data for Spain include 18 of 19 regions. Data for France include 22 regions. Abbreviations: ESRD, end-stage renal disease; sp., speaking. Vol 2, ESRD, Ch 13
Figure 13.11 Trends in the prevalence of treated ESRD, per million population, by country, 2000-2013 Ten countries having the highest % rise in ESRD prevalence from 2000/01 to 2012/13, plus the U.S. Data source: Special analyses, USRDS ESRD Database. ESRD prevalence is unadjusted. Israel includes dialysis patients only from 2000-2002. U.S. is shown for comparison purposes. Abbreviations: ESRD, end-stage renal disease. Vol 2, ESRD, Ch 13
Figure 13.12 Prevalence of treated ESRD, per million population, and health spending per capita (PPP), by region, 2013 Data source: Special analyses, USRDS ESRD Database & World Health Organization Global Health Expenditure database. Data presented only for countries from which relevant information was available. ESRD prevalence is unadjusted and was from 2013 for all countries except Bahrain for which it was from 2011 and Ukraine for which it was from 2012. aCentral & Eastern Europe: Hungary, Romania, Czech Republic, Poland, Bosnia and Herzegovina, Serbia, Slovenia, Russian Federation, Turkey; Western Europe (except. UK, Ireland, & Nordic countries): France, Belgium (French-speaking), Belgium (Dutch-speaking), Spain, Portugal, Greece, Austria, Netherlands; UK, Ireland, Nordic Countries & ANZ: United Kingdom, Ireland, Sweden, Norway, Finland, Denmark, Iceland, Australia, New Zealand; North & Latin America: Argentina, Uruguay, Colombia, Brazil, Mexico (Jalisco), United States, Canada; Eastern & Southeast Asia: South Korea, Malaysia, Singapore, Thailand, Indonesia, Philippines, Japan; Middle East & Africa: Bahrain, Israel, Iran, Qatar, Saudi Arabia, South Africa. Abbreviations: ESRD, end-stage renal disease; PPP, purchasing power parity; pmp, per million population. Vol 2, ESRD, Ch 13
Figure 13.13 Prevalence of treated ESRD, per million population, and human development index, by region, 2013 Data source: Special analyses, USRDS ESRD Database & United Nations Development Programme. Data presented only for countries from which relevant information was available. ESRD prevalence is unadjusted and was from 2013 for all countries except Bahrain for which it was from 2011 and Ukraine for which it was from 2012. aCentral & Eastern Europe: Hungary, Romania, Czech Republic, Poland, Bosnia and Herzegovina, Serbia, Slovenia, Russian Federation, Turkey; Western Europe (except. UK, Ireland, & Nordic countries): France, Belgium (French-speaking), Belgium (Dutch-speaking), Spain, Portugal, Greece, Austria, Netherlands; UK, Ireland, Nordic Countries & ANZ: United Kingdom, Ireland, Sweden, Norway, Finland, Denmark, Iceland, Australia, New Zealand; North & Latin America: Argentina, Uruguay, Colombia, Brazil, Mexico (Jalisco), United States, Canada; Eastern & Southeast Asia: South Korea, Malaysia, Singapore, Thailand, Indonesia, Philippines, Japan; Middle East & Africa: Bahrain, Israel, Iran, Qatar, Saudi Arabia, South Africa. Abbreviations: ESRD, end-stage renal disease; pmp, per million population. Vol 2, ESRD, Ch 13
Figure 13.14 Prevalence of treated ESRD, per million population, and percentage of diabetes, by region, 2013 Data source: Special analyses, USRDS ESRD Database & International Diabetes Federation, Diabetes Atlas. Data presented only for countries from which relevant information was available. ESRD prevalence is unadjusted and was from 2013 for all countries except Bahrain for which it was from 2011 and Ukraine for which it was from 2012. Diabetes percentage refers to the percentage of people ages 20-79 who have type 1 or type 2 diabetes. aCentral & Eastern Europe: Hungary, Romania, Czech Republic, Poland, Bosnia and Herzegovina, Serbia, Slovenia, Russian Federation, Turkey; Western Europe (except. UK, Ireland, & Nordic countries): France, Belgium (French-speaking), Belgium (Dutch-speaking), Spain, Portugal, Greece, Austria, Netherlands; UK, Ireland, Nordic Countries & ANZ: United Kingdom, Ireland, Sweden, Norway, Finland, Denmark, Iceland, Australia, New Zealand; North & Latin America: Argentina, Uruguay, Colombia, Brazil, Mexico (Jalisco), United States, Canada; Eastern & Southeast Asia: South Korea, Malaysia, Singapore, Thailand, Indonesia, Philippines, Japan; Middle East & Africa: Bahrain, Israel, Iran, Qatar, Saudi Arabia, South Africa. Abbreviations: ESRD, end-stage renal disease; pmp, per million population. Vol 2, ESRD, Ch 13
Table 13.4 Health development indicators and the prevalence of treated ESRD across countries, 2013 (Continueon the next slide) Vol 2, ESRD, Ch 13
Table 13.4 Health development indicators and the prevalence of treated ESRD across countries, 2013 (Continued) Data source: Special analyses, USRDS ESRD Database & World Health Organization Global Health Expenditure database, United Nations Development Programme, International Diabetes Federation, Diabetes Atlas. Data presented only for countries from which relevant information was available. ESRD prevalence is unadjusted and reflects the most recent available prevalence since 2010. Diabetes percentage refers to the percentage of people ages 20-79 who have type 1 or type 2 diabetes. Abbreviations: ESRD, end-stage renal disease; PPP, purchasing power parity; pmp, per million population. Vol 2, ESRD, Ch 13
Figure 13.15 Prevalence of dialysis, per million population, by country, 2013 Data source: Special analyses, USRDS ESRD Database. The prevalence is unadjusted and reflects prevalence at the end of 2013. ^United Kingdom: England, Wales, Northern Ireland (Scotland data reported separately). Data for Indonesia represent the West Java region. Data for Spain include 18 of 19 regions. Data for France include 22 regions. Data for Belgium do not include patients younger than 20. Abbreviations: sp., speaking. Vol 2, ESRD, Ch 13
Figure 13.16 Trends in the prevalence of dialysis, per million population, by country, 2000-2013 Ten countries having the highest % rise in dialysis prevalence from 2000/01 to 2012/13, plus the U.S. Data source: Special analyses, USRDS ESRD Database. The prevalence is unadjusted and reflects prevalence of dialysis at the end of each year. U.S. is shown for comparison purposes. Abbreviations: ESRD, end-stage renal disease. Vol 2, ESRD, Ch 13
Table 13.5 Trends in the prevalence of dialysis, per million population, by country, 2000-2013 (Continueon the next slide) Vol 2, ESRD, Ch 13
Table 13.5 Trends in the prevalence of dialysis, per million population, by country, 2000-2013 (Continued) Data source: Special analyses, USRDS ESRD Database. Data presented only for countries from which relevant information was available. The prevalence is unadjusted and reflects prevalence of dialysis at the end of each year. ^United Kingdom: England, Wales, & Northern Ireland (Scotland data reported separately). Data for France include 15 regions in 2006, 18 in 2007, 20 in 2008, and 22 in 2009-2013. Data for Belgium do not include patients younger than 20. Data for Spain include 18 of 19 regions. a% change is calculated as the percent difference between the average prevalence in 2012 and 2013 and the average in 2000 and 2001. Abbreviations: sp., speaking; . signifies data not reported. Vol 2, ESRD, Ch 13
Figure 13.17 Distribution of the percentage of prevalent dialysis patients using in-center HD, home HD, or peritoneal (CAPD/APD/IPD), 2013 Data source: Special analyses, USRDS ESRD Database. Denominator is calculated as the sum of patients receiving HD, PD, or Home HD; does not include patients with other/unknown modality. ^United Kingdom: England, Wales, & Northern Ireland (Scotland data reported separately). Data for Spain include 18 of 19 regions. Data for France include 22 regions. Data for Belgium do not include patients younger than 20. Abbreviations: CAPD, continuous ambulatory peritoneal dialysis; APD, automated peritoneal dialysis; IPD, intermittent peritoneal dialysis; ESRD, end-stage renal disease; HD, hemodialysis; PD, peritoneal dialysis; sp., speaking. Vol 2, ESRD, Ch 13
Table 13.6 Distribution of the percentage of prevalent dialysis patients using in-center HD, home HD, or peritoneal dialysis (CAPD/APD/IPD), 2000-2013 (Continueon the next slide) Vol 2, ESRD, Ch 13
Table 13.6 Distribution of the percentage of prevalent dialysis patients using in-center HD, home HD, or peritoneal dialysis (CAPD/APD/IPD), 2000-2013 (Continued) (Continueon the next slide) Vol 2, ESRD, Ch 13
Table 13.6 Distribution of the percentage of prevalent dialysis patients using in-center HD, home HD, or peritoneal dialysis (CAPD/APD/IPD), 2000-2013 (Continued) (Continueon the next slide) Vol 2, ESRD, Ch 13
Table 13.6 Distribution of the percentage of prevalent dialysis patients using in-center HD, home HD, or peritoneal dialysis (CAPD/APD/IPD), 2000-2013 (Continued) (Continueon the next slide) Vol 2, ESRD, Ch 13
Table 13.6 Distribution of the percentage of prevalent dialysis patients using in-center HD, home HD, or peritoneal dialysis (CAPD/APD/IPD), 2000-2013 (Continued) (Continueon the next slide) Vol 2, ESRD, Ch 13
Table 13.6 Distribution of the percentage of prevalent dialysis patients using in-center HD, home HD, or peritoneal dialysis (CAPD/APD/IPD), 2000-2013 (Continued) Data source: Special analyses, USRDS ESRD Database. Denominator is calculated as the sum of patients receiving HD, PD, or Home HD; does not include patients with other/unknown modality. Data prior to 2013 represents information on CAPD/CCPD. ^United Kingdom: England, Wales, & Northern Ireland (Scotland data reported separately). Data for Spain include 18 of 19 regions. Data for France include 22 regions. Data for Belgium do not include patients younger than 20. Abbreviations: CAPD, continuous ambulatory peritoneal dialysis; APD, automated peritoneal dialysis; IPD, intermittent peritoneal dialysis; CCPD, continuous cycling peritoneal dialysis; ESRD, end-stage renal disease; HD, hemodialysis; PD, peritoneal dialysis; sp., speaking. Vol 2, ESRD, Ch 13
(a) Per million population Figure 13.18 Kidney transplantation rate, per million population, by country, 2013 Data source: Special analyses, USRDS ESRD Database. Data presented only for countries from which relevant information was available. All rates are unadjusted. ^United Kingdom: England, Wales, & Northern Ireland (Scotland data reported separately). Data for Belgium do not include patients younger than 20. Data for France include 22 regions. Transplant data for Romania are limited to that available in dialysis center reports and includes only non-preemptive transplants. Data for Spain include all regions. Abbreviations: sp., speaking. Vol 2, ESRD, Ch 13
Figure 13.18 Kidney transplantation rate, per 1000 dialysis patients, by country, 2013 (b) Per 1000 dialysis patients Data source: Special analyses, USRDS ESRD Database. Data presented only for countries from which relevant information was available. All rates are unadjusted. ^United Kingdom: England, Wales, & Northern Ireland (Scotland data reported separately). Data for Belgium do not include patients younger than 20. Data for France include 22 regions. Transplant data for Romania are limited to that available in dialysis center reports, and include only non-preemptive transplants. Data for Spain include all regions. Abbreviations: sp., speaking. Vol 2, ESRD, Ch 13
Table 13.7 Kidney transplantation rates, per million population, by country 2000-2013 (Continueon the next slide) Vol 2, ESRD, Ch 13
Table 13.7 Kidney transplantation rates, per million population, by country 2000-2013 (Continued) Data source: Special analyses, USRDS ESRD Database. Data presented only for countries from which relevant information was available. Prevalence is unadjusted. ^United Kingdom: England, Wales, & Northern Ireland (Scotland data reported separately). Data for France include 15 regions in 2006, 18 in 2007, 20 in 2008, and 22 in 2009-2013. Data for Belgium do not include patients younger than 20. There is underreporting of prevalent transplant patients in Turkey . a% change is calculated as the percent difference between the average prevalence in 2012 and 2013 and the average in 2000 and 2001. Abbreviations: ESRD, end-stage renal disease; sp., speaking; . signifies data not reported. Vol 2, ESRD, Ch 13
Figure 13.19 Kidney transplantation rate, per million population, by country, 2000-2013 Ten countries having the highest % rise in kidney transplantation rate from 2000/01 to 2012/13, plus the U.S. Data source: Special analyses, USRDS ESRD Database. All rates are unadjusted. Data for Croatia are missing from 2006-2011, as indicated by the dashed line. Abbreviations: ESRD, end-stage renal disease. Vol 2, ESRD, Ch 13
Figure 13.20 Distribution of the percentage of kidney transplantations, by kidney donor type and country, 2013 Data source: Special analyses, USRDS ESRD Database. Denominator is calculated as the sum of deceased, living donor, and unknown transplants. ^United Kingdom: England, Wales, & Northern Ireland (Scotland data reported separately). Data for France include 22 regions. Abbreviations: ESRD, end-stage renal disease. Vol 2, ESRD, Ch 13
Figure 13.21 Prevalence of treated ESRD patients with a functioning kidney transplant, per million population, by country, 2013 Data source: Special analyses, USRDS ESRD Database. Data presented only for countries from which relevant information was available. Prevalence is unadjusted. Data for France include 22 regions. ^United Kingdom: England, Wales, & Northern Ireland (Scotland data reported separately). Data for Belgium do not include patients younger than 20. Abbreviations: ESRD, end-stage renal disease; sp., speaking. Vol 2, ESRD, Ch 13
Table 13.8 Trends in the prevalence of treated ESRD patients with a functioning kidney transplant, per million population, by country, 2000-2013 (Continueon the next slide) Vol 2, ESRD, Ch 13