12.4 Counting Outcomes and Theoretical Probability
190 likes | 540 Vues
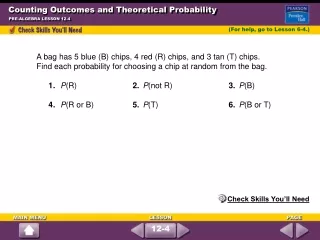
12.4 Counting Outcomes and Theoretical Probability. Theoretical Probability:. Counting the outcomes that are likely. Sample Space. A list of all possible outcomes Use a tree diagram to find sample space Then calculate probability. Understanding a Tree Diagram.

12.4 Counting Outcomes and Theoretical Probability
E N D
Presentation Transcript
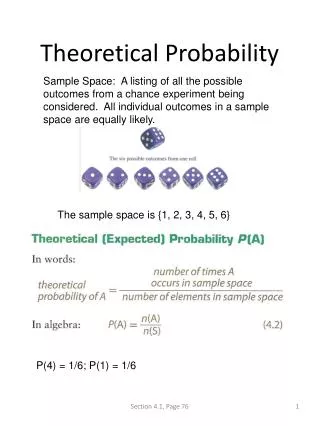
Theoretical Probability: Counting the outcomes that are likely
Sample Space • A list of all possible outcomes • Use a tree diagram to find sample space • Then calculate probability
Understanding a Tree Diagram Use a tree diagram to show all the possible outcomes for boys and girls in a family of three.
Understanding a Tree Diagram Use a tree diagram to show all the possible outcomes for boys and girls in a family of three.
Understanding a Tree Diagram Use a tree diagram to show all the possible outcomes for boys and girls in a family of three.
Understanding Possible Outcomes BGG BBG GGB GBB GBG GGG BGB BBB
Understanding Possible Outcomes BGG GGB GBB GBG GGG BGB BBB BBG
Understanding Possible Outcomes BGG GGB GBB GBG GGG BGB BBB BBG
Understanding Possible Outcomes GGB GBB GBG GGG BGB BGG BBB BBG
3 8 Probability of Multiple Events - Tree Diagrams A nickel, dime, and quarter are tossed. Find the probability of the following. Nickel Dime Quarter Outcomes H H H H H T H H T H H H T H T T H T T H T H H H T T H T T H T T H T T T T T 1) P(Only one heads) 2) P(At least two heads)
3 1 4 2 8 8 Probability of Multiple Events - Tree Diagrams A nickel, dime, and quarter are tossed. Find the probability of the following. Nickel Dime Quarter Outcomes H H H H H T H H T H H H T H T T H T T H T H H H T T H T T H T T H T T T T T 1) P(Only one heads) 2) P(At least two heads) =
Finding How Many Total Outcomes If you have four shirts, six pairs of pants and eight pairs of socks. How many different outfits can you wear? Multiply each number of choices to find out the total number of outcomes Also known as: Counting Principle
You are offered ice cream with your choice of waffle or sugar cone, an ice cream flavor of vanilla, chocolate, or strawberry, and one of two toppings: chocolate chips or sprinkles.
1. Make a tree diagram to list the ice cream possibilities. 2. How many different ice creams (total outcomes) are possible? 3. List your possibilities. Make sure your list of possibilities has the same amount as the total number of outcomes.
4. What is the probability that your ice cream is with a topping of chocolate chips on a waffle cone? Write your answer as a fraction, a decimal, and a percent.
Homework • Page 629 (4-17) all