Weather Instruments
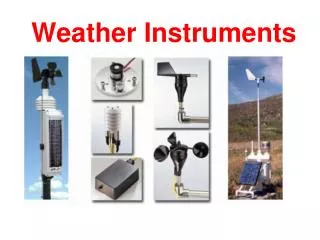
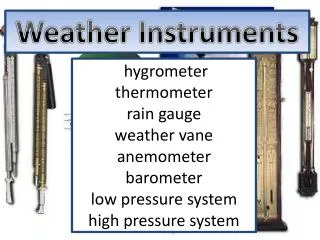
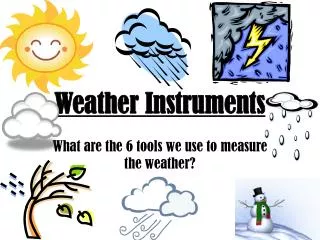
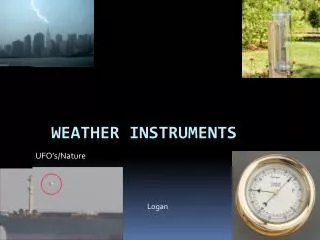
Weather Instruments. P 611-614. We need data to forecast the weather. Temperature Air pressure Humidity Type of clouds Level of precipitation Wind direction and speed. Instruments used to gather the data. Lower Atmospheric Conditions Temperature Thermometer

Weather Instruments
E N D
Presentation Transcript
Weather Instruments P 611-614
We need data to forecast the weather • Temperature • Air pressure • Humidity • Type of clouds • Level of precipitation • Wind direction and speed
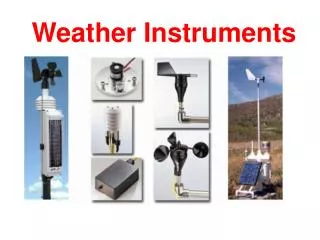
Instruments used to gather the data • Lower Atmospheric Conditions Temperature • Thermometer • Uses a liquid either mercury or alcohol sealed in a glass tube • Electrical thermometer • As temp rises the electrical current increases • A thermistor responds very quickly and is used where temps change quickly
Air pressure Barometer • Aneroid (pictured) • Mercury • fronts are usually indicated by a drop in air pressure
Wind Speed and direction • Anemometer • Wind speed • Wind vane • Wind direction
Rainfall • Rain gauge
Radar Stands for radio detection and ranging • Uses reflected radio waves Doppler radar • Can indicate precise location, intensity of precip and extent of a storm • Shows wind patterns • Towards or away from the radar
Radiosonde • An instrument package that is carried by a helium-filled balloon • Radio sends info to ground • Determines direction and speed of high altitude winds
Skew-T • Shows a vertical slice of the atmosphere • Temperature on right • Dew point on left • Air pressure • Wind speed and direction
Weather Satellites Can measure • visible • Infrared • Ocean conditions • temperature and flow of ocean currents and • height of ocean waves
Computers • Solve mathematical equations that describe the behavior of the atmosphere • Can store weather data • Can store weather records
This info is reported from stations • WMO World Meteorological Organization • 10,000 land based stations and hundreds of ship-based stations • Weather satellites • GOES Global Orbiting Earth Satellite
Data from stations is compiled and analyzed to forecast • In the past this was done by hand • Now much is done by computer • But, different programs work better for different locations and types of weather • Often two or three computer models are consulted to make one forecast
Weather Station Symbols • Temperature is upper left corner • Barometric (air) pressure is upper right
Air pressure • represents the last three digits of the observed pressure reading in millibars (mb) • Like on previous labs
Dew point • Dew Point is lower left corner • When the air temperature and the dew point are the same the air is saturated • Relative humidity can be inferred • High if temp and dp are close • Low if large difference between dp and temp
Relative Humidity can be inferred • When the air and dew point temperatures are very close, this indicates that the air has a high relative humidity. • The opposite is true when there is a large difference between air and dew point temperatures, which points to air with a low relative humidity.
Wind Speed and Direction • Wind stick points in the direction "from" which the wind is blowing • Which direction is the wind from?
Wind Speed • May be measured in mph, km/hr or knots • The more barbs the windier it is • Each long barb is approx 10 knots
Worksheets Surface Weather Map • Study the tables and the station model • Use the info to answer the questions Transparency worksheets • Study the tables and the station model • Use the info to answer the questions
Dry Line • Note the sharp difference in dew points • The line that separates dry air from moist air
Isobars • Lines that connect points with equal air pressure • Drawn at 4 mb (millibar) intervals
Pressure and Wind Relationships • Draw isobars • Use pencil • CI = 4 • Mark high and low pressure • Answer the questions
Methods of Forecasting • Persistence • Trend • Analog
Persistence • Persistence—based on continuity of a weather pattern—if it is raining now it will probably be raining tomorrow
Trend • Trend—based on the movement or trend of the weather system Ex. Cold front moving E at 20 Km/hr will affect weather 80 KM away in 4 hours
Others Climatology—data accumulated through many years 4th of July is usually hot and dry Numerical Weather Prediction—uses programs built by meteorologists Not exact compares present weather (cloud cover, wind, temperature, humidity, etc) with weather conditions produced by same features in the past Analog
Meteorologists What high school courses are necessary to prepare for a career in meteorology? • Because meteorology is a science, a good background in mathematics and the sciences is mandatory. Knowledge of physics and chemistry is helpful toward a career in the atmospheric sciences.
Weather Station Symbols • Temperature is upper left corner • Barometric (air) pressure is upper right
Lab • Do isotherms in red (every 2) • Do lightly in pencil first • Do isobars in blue (Every4) • Do lightly in pencil first
Three causes of motion(recap) WIND ALWAYS FLOWS FROM HIGH TO LOW PRESSURE 1. Warm air rises and cool air sinks because of density • This is called a convection current 2.pressure differences in the atmosphere that are a result of temperature differences • Wind is horizontal air movement 3. The deflection of objects to the right in the northern hemisphere—called the Coriolis Effect • Due to rotation of the earth
Highs and Lows? • Winds circle Clockwise around a high • Highs generally mean cold dry air that is sinking • High pressure usually = fair weather
Low Pressure Systems • Winds circle counterclockwise around a low • Warmer air rises and cools and forms clouds and precipitation • Low pressure usually = rainy weather
Global Circulation Patterns • We are located in theWesterlies section • That means our weather moves from the west coast to the east coast
Overall movement is west to east • Local wind patterns can be from any direction
Recognizing fronts on a map • sharp temperature changes over relatively short distances • changes in the moisture content of the air (dew point) • shifts in wind direction • low pressure troughs and pressure changes • clouds and precipitation patterns
Types of fronts • Named for the invader • Each type of front has a typical weather scenario
Cold Front • heavy cold air displaces lighter warm air, pushing it upward • Cumulus clouds form and usually grow into thunderstorms • Temperatures drop anywhere from 5 to 15. • Winds become gusty and erratic. • Rain, snow, sleet, and hail can occur with a cold front.
Warm Front • Warm fronts occur when warm air replaces cold air by sliding over it. • Altocumulus clouds form and may be associated with rain, snow, or sleet. • Temperatures may warm slightly. • Winds are usually gentle with this kind of front.