Efficient Insulation Studies for Cost-Effective Homes
Matthew Irvine and Cristina Belew explored various insulation methods to reduce energy costs in partnership with Habitat for Humanity. They recommend cost-effective insulation strategies for walls, attics, and ducts. The study includes design modeling, with findings favoring fiberglass insulation.

Efficient Insulation Studies for Cost-Effective Homes
E N D
Presentation Transcript
By: Matthew Irvine and Cristina Belew Insulation studies
Origination and Goals • Partnership with Habitat for Humanity • Their goal is to lower the overall cost to owner • Studied the effect of insulation on energy costs • Looked for the effects of different insulations and insulating methods • Recommend the insulations with the lowest cost to owner
Four Different Areas • Wall insulation types • Framing dimension selection • Attic insulation • Duct Insulation
Design Modeling Assumptions • h and k values • No thermal contact resistance • Siding geometry • No radiation in attic, theoretical venting
Decision of appropriate options • Wall Insulation • Stud Sizing • Duct Insulation
Modeling Techniques • We began with a square foot section • Moved to a larger section with other elements included • Completed our analysis by simulating an entire house (Woodruff House)
Studied Design Description • Small and large wall section for 2X4 and 2X6 • Attic Section • Duct Section
2 x 4 Stud, 1 x 1 m2 Section: Overview Hardiboard • Equation for heat flux • Q = (T2 – T1)/Rtotal • Studied 3 times during the year • January – 2.778 ºC • April – 15.56 ºC • July - 27.2 ºC • Desired inside temperature- 22.2 ºC Insulation Drywall Plywood Air Pocket
2 x 4 Stud, 1 x 1 m2 Section: R-values • R of Convection – 1/h*A • h- convection coefficient (W/m·°C) • A- area of convection (m2) • R of a certain material – L/k*A • k- thermal conductivity • L- thickness of material (m) • A- area of material (m2) • Rtotal = Routside,convection + Rdrywall + Rinsulation + Rhariboard + Rair pocket + Rsiding +Rinside,convection
2 x 4 Stud, 1 x 1 m2 Section: Theoretical vs. Simulation Heat Flux • Heat flux for each insulation and temperature difference was calculated next with Solidworks and compared to the theoretical calculations done.
2 x 4 Stud, 1 x 1 m2 Section: FEA (January) 0.042 W/m2·ºC 0.03 W/m2·ºC 0.046 W/m2·ºC
2 x 4 Stud, 1 x 1 m2 Section: FEA (April) 0.042 W/m2·ºC 0.03 W/m2·ºC 0.046 W/m2·ºC
2 x 4 Stud, 1 x 1 m2 Section: FEA (July) 0.042 W/m2·ºC 0.03 W/m2·ºC 0.046 W/m2·ºC
2 x 6 Stud, 1 x 1 m2 Section: R-values • Next Step: How does the heat flux change when more insulation is added with a 2 x 6. • The R-values were calculated again when a thicker insulation.
2 x 6 Stud, 1 x 1 m2 Section: Theoretical vs. Simulation Heat Flux • Here are the heat flux numbers for the SolidWorks simulations compared to the theoretical calculations done:
2 x 6 Stud, 1 x 1 m2 Section: FEA (January) 0.042 W/m2·ºC 0.03 W/m2·ºC 0.046 W/m2·ºC
2 x 6 Stud, 1 x 1 m2 Section: FEA (April) 0.042 W/m2·ºC 0.03 W/m2·ºC 0.046 W/m2·ºC
2 x 6 Stud, 1 x 1 m2 Section: FEA (July) 0.042 W/m2·ºC 0.03 W/m2·ºC 0.046 W/m2·ºC
Conclusions from Theoretical and SolidWorks Studies of 1 x 1 m2 Section • Based upon this data, fiberglass is the insulation to choose. The heat flow through the section of wall is the lowest compared to the other insulation choices.
3 Sections of Wall with 2 x 4 Studs: Overview Studs • The next step: A bigger section of wall with studs included. • The R-values had to be calculated for the sections of wall next to the studs and next to the insulation. Hardiboard Insulation Drywall Plywood
3 Sections of Wall with 2 x 4 Studs: FEA (January) 0.03 W/m2·ºC 0.046 W/m2·ºC 0.042 W/m2·ºC
3 Sections of Wall with 2 x 4 Studs: FEA (April) 0.03 W/m2·ºC 0.046 W/m2·ºC 0.042 W/m2·ºC
3 Sections of Wall with 2 x 4 Studs: FEA (July) 0.042 W/m2·ºC 0.03 W/m2·ºC 0.046 W/m2·ºC
Duct Insulation: Overview • Next step: Determine what size fiberglass insulation is best • Assumptions: • Air flowing through is 22.2 °C • Air surrounding duct is the temperature of the outside since placed in attic • Three fiberglass insulation size choices of 2 inches, 4 inches and 6 inches. • The analysis in Solidworks was performed on a three foot section of duct. Fiberglass insulation Reflective Barrier Air Flow Aluminum Core
Duct Insulation: R-values • For a cylinder, the equation for the total r-value changes. It is dependent on the radius of each section of material.
Duct Insulation: FEA Simulation (January) January Analysis: Temperature flow through the center at 22.2 ºC and the surrounding temperature 2.778 ºC 2 inches 4 inches 6 inches
Duct Insulation: FEA Simulation (April) April Analysis: Temperature flow through the center at 22.2 ºC and surrounding temperature at 15.56 ºC 2 inches 4 inches 6 inches
Duct Insulation: FEA Simulation (July) July Analysis: Temperature flow through the center at 22.2 ºC and the surrounding temperature 27.2ºC 2 inches 4 inches 6 inches
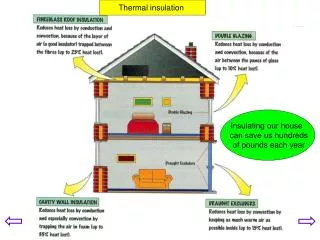
Attic Insulation: Overview • Next Step: Which insulation is the best choice for the attic • Assumptions: • Attic temperature is the outside temperature • Inside temperature is 22.2 °C Insulation Drywall
House Model: Overview • Next Step: Move from a small section of wall or attic to a full wall or ceiling. • Each section of wall was simulated separately and then the heat flux of all were added together.
House Model: FE Analysis • Here are the results for the heat flux traveling through each wall of the house model.
House Model: FEA Simulation Right and Left Walls
House Model: FEA Simulation • Front Wall
Quantitative Results • Insulation Type (30%) • Duct Thickness (36% compared to 20%) • Stud Sizing (~30%)
Future Work • Determine thermal conductivities for each insulation • Find quantitative difference of heat flux for different insulation choices • Compare cost difference between insulations with energy savings or loses